+41 768307656
info@htc-sagl.ch

Archive: 06/03/2023

Key Distinctions between Scientists and Engineer, to empower Data Analytics

Data analytics is a growing field, where data scientists and engineers are crucial for its success. Both roles involve working with data, but have distinct responsibilities. Science is more like research, while data engineering is more like development. The first analyze data to extract insights and make predictions, while data engineers design and maintain systems to enable data scientists to work with data.

Data scientists ask the right questions and find meaningful insights from data, while data engineers build and maintain the infrastructure. Engineering involves building the infrastructure to support data science, while data science involves using that infrastructure to extract insights to make data usable, while data science makes sense of it.

Both data scientists and data engineers have strong employment prospects. The demand for data scientists is projected to grow by 16% between 2020 and 2030, and for computer and information technology occupations, which include data engineers, by 11%. The increasing importance of data-driven decision making across industries means that the demand for both roles will continue to rise.

If you want to become a data engineer or data scientist, there are various educational paths to take. Many universities offer undergraduate and graduate programs in data science, computer science, or related fields. Additionally, various online courses and bootcamps offer training in data analytics, machine learning, and other relevant skills.

Data science and data engineering have vast and varied applications. In healthcare, data analytics improves patient outcomes and streamlines processes. In finance, data analytics detects fraud and predicts market trends. In retail, data analytics personalizes marketing campaigns and optimizes supply chain operations. Data science and data engineering drive innovation and create value across industries.

Conclusion

In conclusion, data scientists and data engineers are critical for data analytics success, with essential, distinct responsibilities. The demand for both roles will continue to increase, as data-driven decision making becomes more important. Pursuing a career in data analytics offers various educational paths and fields of application to explore.

Further resources

  1. “Python Data Science Handbook” by Jake VanderPlas: https://jakevdp.github.io/PythonDataScienceHandbook/
  2. “Data Science Essentials” by Microsoft: https://docs.microsoft.com/en-us/learn/paths/data-science-essentials/
  3. “Data Engineering Cookbook” by O’Reilly Media: https://www.oreilly.com/library/view/data-engineering-cookbook/9781492071424/
  4. “Data Science for Business” by Foster Provost and Tom Fawcett: https://www.amazon.com/Data-Science-Business-data-analytic-thinking/dp/1449361323
  5. “Data Engineering on Google Cloud Platform” by Google Cloud: https://cloud.google.com/solutions/data-engineering/
  6. “Applied Data Science with Python” by Coursera: https://www.coursera.org/specializations/data-science-python
Supervised, Unsupervised & Reinforced Learning, a quick intro!

In the field of predictive maintenance for rotating equipment, machine learning algorithms can be classified into three categories: supervised learning, unsupervised learning, and reinforced learning. Each of these approaches has its strengths and weaknesses, and choosing the right approach depends on the nature of the problem at hand. In this essay, we will explore the differences between these approaches and their applications in the context of predictive maintenance for rotating equipment.

Supervised Learning

Supervised learning involves training a model on labeled data, where both the input data and the desired output are provided. The goal is to learn a function that can predict the output for new, unseen input data. In the context of predictive maintenance for rotating equipment, supervised learning can be used to predict the remaining useful life of a machine or to detect anomalies that may indicate the onset of a fault.

One common application of supervised learning in predictive maintenance is to analyze vibration data from rotating machinery. By training a model on labeled data that indicates when a fault occurred and the corresponding vibration patterns, the algorithm can learn to identify these patterns in real-time data and predict potential faults before they occur.

Unsupervised Learning

Unsupervised learning involves training a model on unlabeled data, where the input data is provided without any corresponding output. The goal is to find patterns or structures in the data that can be used to make predictions or identify anomalies. In the context of predictive maintenance for rotating equipment, unsupervised learning can be used to identify patterns or clusters in sensor data that may indicate the presence of a fault.

One common application of unsupervised learning in predictive maintenance is to use clustering algorithms to group similar data points together. By analyzing the clusters, it may be possible to identify patterns that are indicative of a specific type of fault or to detect anomalies that may indicate the onset of a fault.

Reinforced Learning

Reinforcement learning involves training a model to make decisions based on feedback from the environment. The goal is to learn a policy that maximizes a reward signal over time. In the context of predictive maintenance for rotating equipment, reinforced learning can be used to develop maintenance schedules that minimize downtime and reduce costs.

One common application of reinforced learning in predictive maintenance is to use a model to determine when maintenance should be performed based on the condition of the machine and the cost of downtime. By learning a policy that balances the cost of maintenance with the cost of downtime, it may be possible to develop a more efficient maintenance schedule that reduces costs and increases efficiency.

Choosing the Right Approach

The choice of machine learning approach depends on the nature of the problem at hand. Supervised learning is best suited for problems where labeled data is available, and the goal is to predict an output for new, unseen data. Unsupervised learning is best suited for problems where the data is not labeled, and the goal is to identify patterns or anomalies in the data. Reinforced learning is best suited for problems where the goal is to develop a policy that maximizes a reward signal over time.

In the context of predictive maintenance for rotating equipment, a combination of these approaches may be used to develop a comprehensive predictive maintenance strategy. For example, supervised learning can be used to predict the remaining useful life of a machine, unsupervised learning can be used to identify patterns or clusters in sensor data, and reinforced learning can be used to develop a maintenance schedule that balances the cost of maintenance with the cost of downtime.

Conclusion

In conclusion, machine learning algorithms can be classified into three categories: supervised learning, unsupervised learning, and reinforced learning. Each of these approaches has its strengths and weaknesses, and choosing the right approach depends on the nature of the problem at hand. In the context of predictive maintenance for rotating equipment, a combination of these approaches may be used to develop a comprehensive predictive maintenance strategy that minimizes downtime, reduces costs

Hydrogen from Ammonia, a fuel for the future

Green ammonia is an emerging technology that has the potential to revolutionize the production of hydrogen and significantly reduce carbon emissions. In this article, we will discuss the production of hydrogen from green ammonia, key production and money figures, companies involved, and future trends.

Production of Hydrogen from Green Ammonia

Green ammonia is produced by using renewable energy sources such as wind or solar power to power the Haber-Bosch process, which produces ammonia. Green ammonia can then be used as a feedstock for the production of hydrogen through the process of ammonia cracking. The reaction is endothermic, requiring a reactor heated to a high temperature of around 700-900°C to break down ammonia into its constituent elements, nitrogen and hydrogen.

Key Production and Money Figures

The production of hydrogen from green ammonia has several advantages over traditional methods, including zero carbon emissions and lower energy requirements. According to the International Energy Agency (IEA), the production of green ammonia is expected to reach 25 million tonnes by 2030 and 500 million tonnes by 2050. The IEA also estimates that the production of green ammonia could reduce the cost of producing hydrogen by up to 50% compared to traditional methods.

Companies Involved

Several companies are involved in the production of green ammonia, including Yara, the world’s largest producer of ammonia, and Siemens Energy, which has developed an electrolysis-based process for producing green ammonia. Other companies involved in the production of green ammonia include Ørsted, a leading renewable energy company, and Air Liquide, a global leader in industrial gases.

Future Trends

The future of green ammonia production looks bright, with the potential for significant growth and contribution to reducing carbon emissions in the energy and agricultural sectors. The IEA has identified green ammonia as a key technology that could help to reduce carbon emissions. Green ammonia has the added benefit of being used as a fertilizer, further reducing the carbon footprint of agriculture. In addition, the use of green ammonia in the shipping industry as a fuel is being explored as a potential replacement for fossil fuels.

Conclusion

Green ammonia is a promising technology that has the potential to revolutionize the production of hydrogen and significantly reduce carbon emissions. Key production and money figures suggest that the production of green ammonia could increase significantly over the next few decades, with the potential to reduce the cost of producing hydrogen by up to 50%. Several companies are involved in the production of green ammonia, and the future looks bright with the potential for significant growth and contribution to reducing carbon emissions in the energy and agricultural sectors.

Which Is The Difference Between Data Scientist And Data Engineer?

Data scientist and data engineer are both essential roles in the field of data analytics, but they have distinct responsibilities. According to Max Shron in “Thinking with Data: How to Turn Information into Insights,” “data science is more like a research project, while data engineering is more like a development project.” This means that while data scientists focus on analyzing data to extract insights and make predictions, data engineers are responsible for designing and maintaining the systems that enable data scientists to work with the data.

Andreas Müller and Sarah Guido echo this sentiment in “Introduction to Machine Learning with Python: A Guide for Data Scientists,” stating that “data scientists are concerned with asking the right questions and finding meaningful insights from data. Data engineers are responsible for designing and maintaining the systems that enable data scientists to work with the data.” DJ Patil and Hilary Mason similarly note in “Data Driven: Creating a Data Culture” that “data engineering involves building the infrastructure to support data science, while data science involves using that infrastructure to extract insights from data.”

Joel Grus adds in “Data Science from Scratch: First Principles with Python” that “data engineering involves building the infrastructure to support data science, while data science involves using that infrastructure to extract insights from data.” Finally, Martin Kleppmann sums it up in “Designing Data-Intensive Applications: The Big Ideas Behind Reliable, Scalable, and Maintainable Systems” by saying that “data science is about making sense of data, while data engineering is about making data make sense.”

In summary, data scientists focus on extracting insights from data, while data engineers focus on building the infrastructure to store and process that data. While there may be some overlap between the roles, they have distinct responsibilities and focus on different aspects of working with data. Both roles are crucial in modern data-driven organizations, and they often work together closely to achieve common goals

Rock Music is Alive and Powerful! Statistics from 1950 and 2020

This article was done to get some statistics about rock music and what big data analysis can do to gather or discover hidden useful information.

The following analysis gets the data from Kaggle, free license

What is Kaggle? According to online definitions, Kaggle, a subsidiary of Google LLC, is an online community of data scientists and machine learning practitioners. inside the website can be found courses, datasets, contest/challenges including money.

Dataset can be uploaded by single usernames or by companies during a competition.

 Scope of the Study

A lot of considerations can be made from the history of rock music, but the scope of this study is to support the changes that music rock did during the years.

Rock music, as an alternative of pop music (intended as common or soft) in the beginning was an underground music that gained fame during the years, with a constant increase. Some people or critics claim that rock is dead, but we will seek if there is a truth on this sentence.

  Data

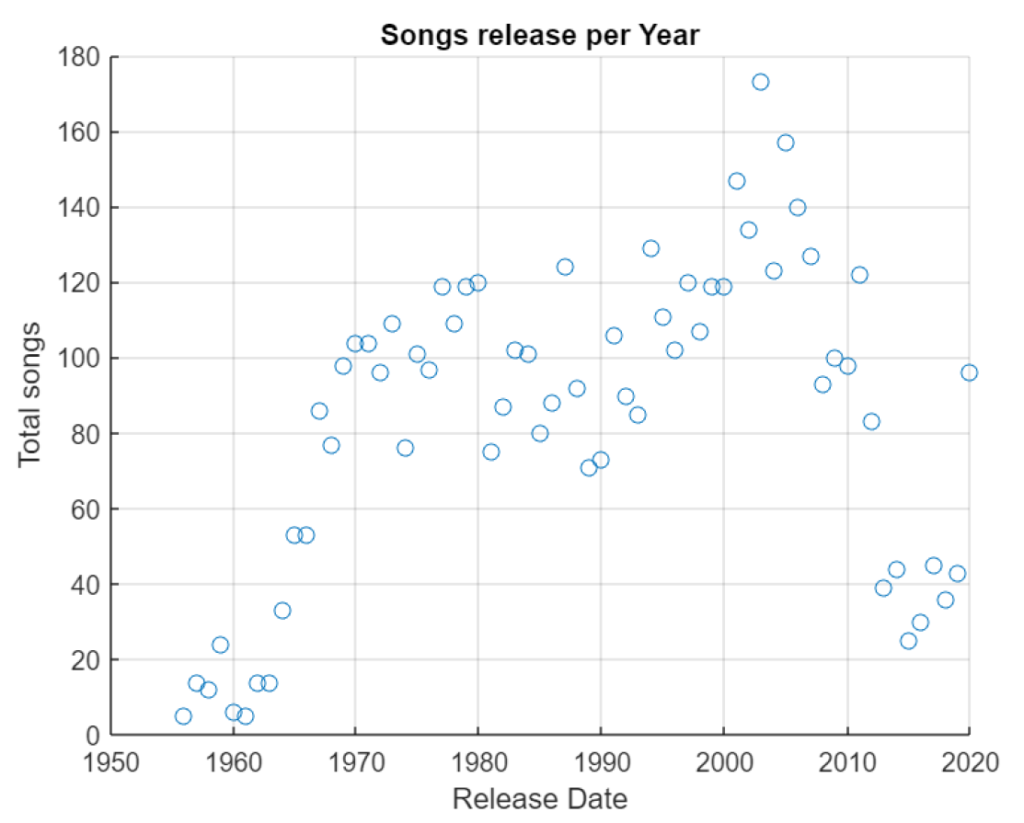
Dataset is from 2020 retrieved from spotify covering rock songs from 1950 to 2020 with 5484 songs and 17 tags/label to identify and classify a song. From the tag list, only popularity is an index from the audience feedback while the remaining tags describe the song characteristics.

  1. Index
  2. Name: Song’s name
  3. Artist
  4. Release date
  5. Length: in minutes
  6. Popularity: A value from 0 to 100
  7. Danceability: Describes how suitable a track is for dancing based on a combination of musical elements including tempo, rhythm stability, beat strength, and overall regularity.
  8. Acousticness: A confidence measure from 0.0 to 1.0 of whether the track is acoustic.
  9. Energy: Represents a perceptual measure of intensity and activity. Typically, energetic tracks feel fast, loud, and noisy. For example, death metal has high energy, while a Bach prelude scores low on the scale.
  10. Instrumentalness: Predicts whether a track contains no vocals. “Ooh” and “aah” sounds are treated as instrumental in this context. Rap or spoken word tracks are clearly “vocal”.
  11. Key: The estimated overall key of the track. Integers map to pitches using standard Pitch Class notation . E.g. 0 = C, 1 = C♯/D♭, 2 = D, and so on.
  12. Liveness: Detects the presence of an audience in the recording. Higher liveness values represent an increased probability that the track was performed live.
  13. Loudness: The overall loudness of a track in decibels (dB). Loudness values are averaged across the entire track and are useful for comparing relative loudness of tracks.
  14. Speechiness: This detects the presence of spoken words in a track. The more exclusively speech-like the recording (e.g. talk show, audio book, poetry), the closer to 1.0 the attribute value.
  15. Tempo: The overall estimated tempo of a track in beats per minute (BPM). In musical terminology, tempo is the speed or pace of a given piece and derives directly from the average beat duration.
  16. Time Signature: An estimated overall time signature of a track. The time signature (meter) is a notational convention to specify how many beats are in each bar (or measure).
  17. Valence: Describes the musical positiveness conveyed by a track. Tracks with high valence sound more positive (e.g. happy, cheerful, euphoric), while tracks with low valence sound more negative (e.g. sad, depressed, angry).

Popularity requires some clarification from analytical point of view and need some assumptions. We don’t know when the popularity was measured, monthly or yearly, and also in which year. Considering this lack of information, we will assume likelihood that popularity was calculed in 2020 when considering songs from 1950 to 2019.

Data Pre-processing & Feature Engineering

After loading the data, we need to manipulate it according to our scope of the study, more specifically we will count the letters both in the artist’s name and song’s name.

The name of the song contains some noise created by the versions mastered or remastered. this creates a distortion in the real name of the song. Most of time, remastering a song has the only effect to clean using new technologies and also to refresh the mind of people.

Since there are 5848 rows in the data, this creates a lot of noise, so the best way for filtering data, is to preprocesssing in aggregated way following statistical parameters, mean, max & min of the values for each year from 1956 to 2020. This leads to a new data set of 65 rows where every row is one year.

Below you can find complete pdf.

historyofrock