+41 768307656
info@htc-sagl.ch

Archive: 22/03/2023

Population and houses growth in Switzerland

Switzerland is known for its high standard of living and picturesque landscapes, making it a popular destination for expats, students, and travelers. However, it is also known for its high cost of living, including housing prices. Renting a flat in Switzerland can be expensive, especially in larger cities such as Zurich, Geneva, and Basel.

The scope of this article is a study to correlate the prices of the house in francs/m2 and correlating them with population. The data used is provided by opendata.swiss and the information of this paper is free of charge.

Data Mining & Preprocessing

All data used in this study was retrieved from opendata.swiss which is the Swiss public administration’s central portal for open government data.

Several files with CSV and XLS extensions were used and adapted to provide a full dataset of information regarding population growth, buildings construction and price variation through the years.

Population data set cover 1950-2020, classified by sex, provenience & canton

Building construction dataset on the other side starts in 2003 to 2020 classified by flat or building & canton

Last set is about price per m2 in swiss francs. This set starts in 2012 until 2020 classified by canton & year of construction, from older than 1919 up to 2021. For our purpose, average through canton value was used in order to homogenize data accross years and building age.

Population data was truncated to start in 2003 to match building construction data set.

Analysis

For the analysis few statistical indicatore were used:

  • Arithmetic mean, also known as the average, is a measure of central tendency that represents the typical value of a set of numbers. It is calculated by adding up all the values in a set and then dividing the sum by the number of values in the set. The arithmetic mean is commonly used in statistics to summarize the data and to compare different sets of data. It is a useful measure of central tendency when the data is evenly distributed and does not have any extreme outliers. However, it can be influenced by outliers, and in such cases, other measures of central tendency such as the median or mode may be more appropriate. Defined as:
  • Standard deviation, The standard deviation is a measure of the amount of variation or dispersion in a set of data. It is calculated as the square root of the variance, which is the average of the squared differences of each value from the mean. The standard deviation is commonly used in statistics to describe the spread of a distribution, with a higher standard deviation indicating a wider spread of values and a lower standard deviation indicating a narrower spread of values. It is also used in inferential statistics to calculate confidence intervals and to test hypotheses about the population from which the sample was drawn. Defined as:
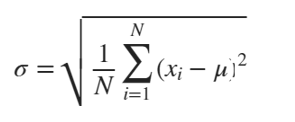
After calculations, graphs were constructed to visualize data and get information.

Population Data

Data recall population from year 1950 until 2020. After importing data, it is usefull to display visual information of total values both for sex and citizenship. The final graph after filtering data is as follows:
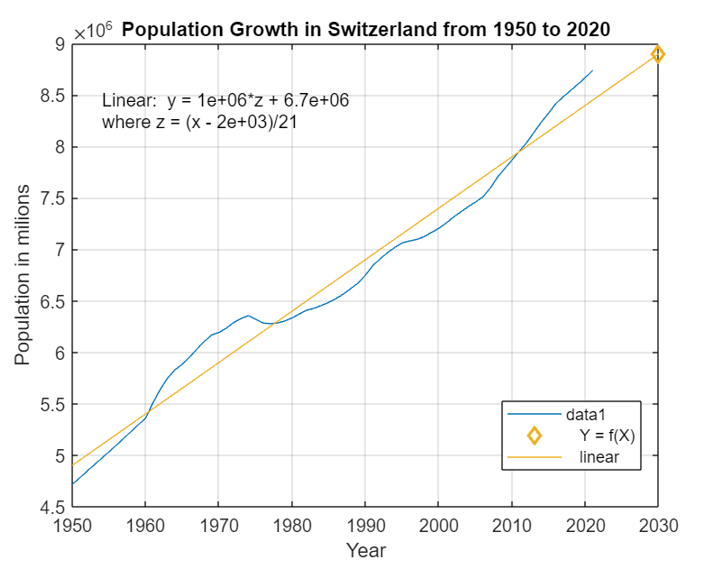
Adding a linear trend, gives that in 2030 the population will be around 9 millions.

To have further detail on population, it is possible to use population change by canton using standard deviation, to see data variation through the years.
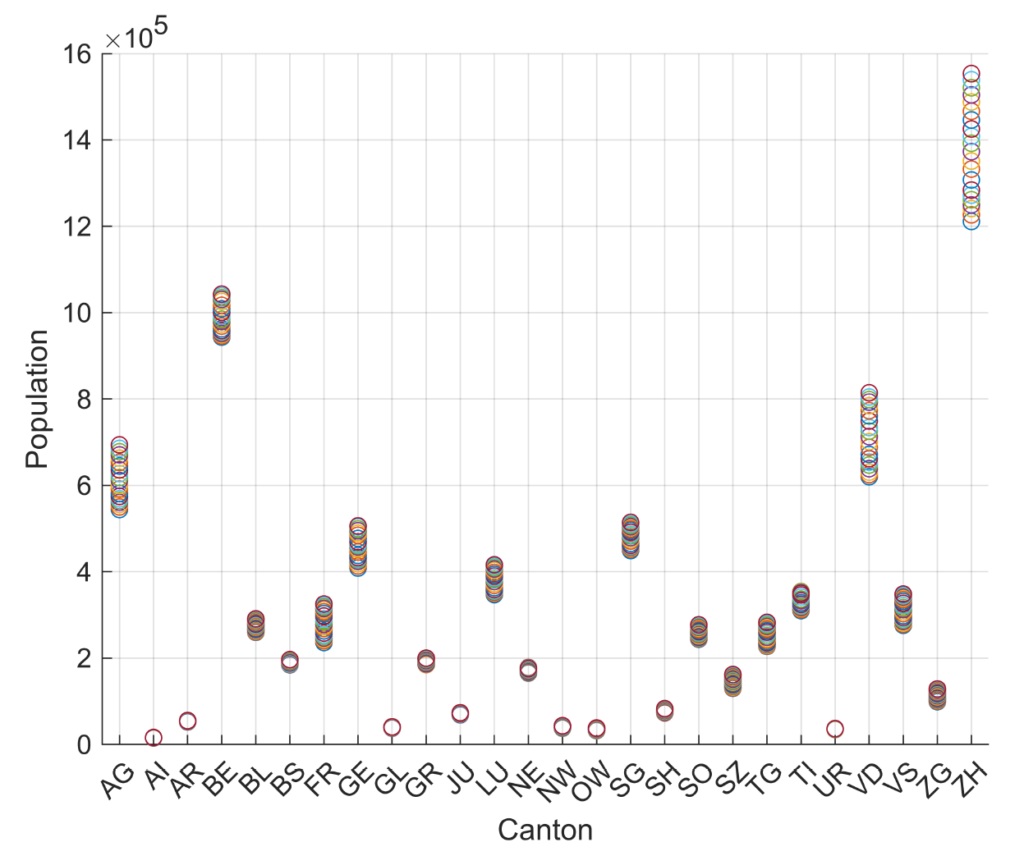
Higher values means high variation in positive(growing) direction

Houses Data

Data about constructions in switzerland is imported. This data covers from 2003 to 2020.
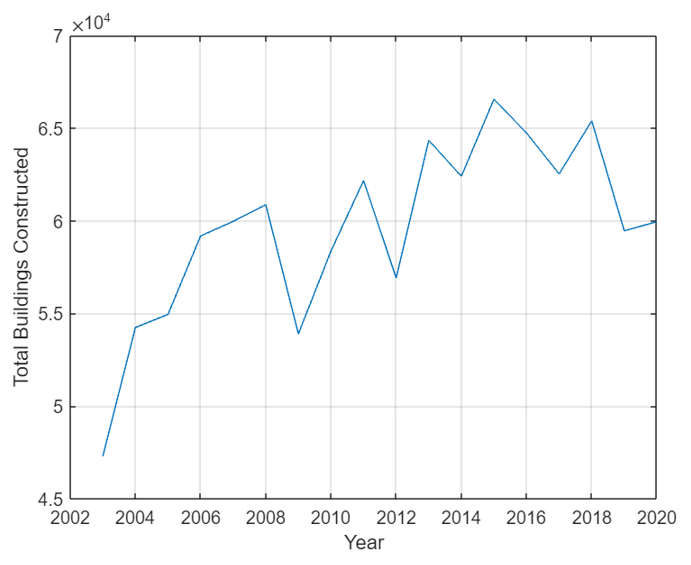
It is clearly visible that the number of new construction reaches its peak in 2015 and then change its direction to the lower values.

Rent average price m2/chf

Data is categorized by canton and year, from 2012 to 2020 and the value is expressed as average through 26 cantons. Due to lowering number of new construction, one can say that prices will growth. For this reason, this dataset can be usefull to study if there are some variation in the prices. Note that this values includes existing buildings and new constructed. Original dataset considers building older that 1919 up to 2021. For practical purposes, data was filtered.
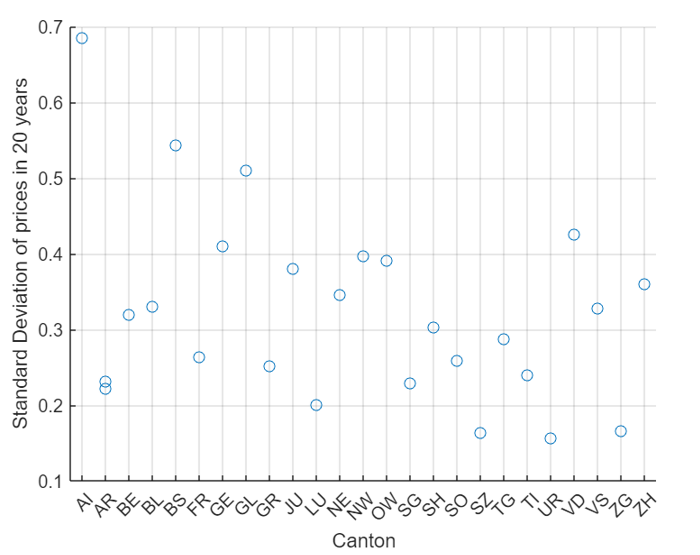
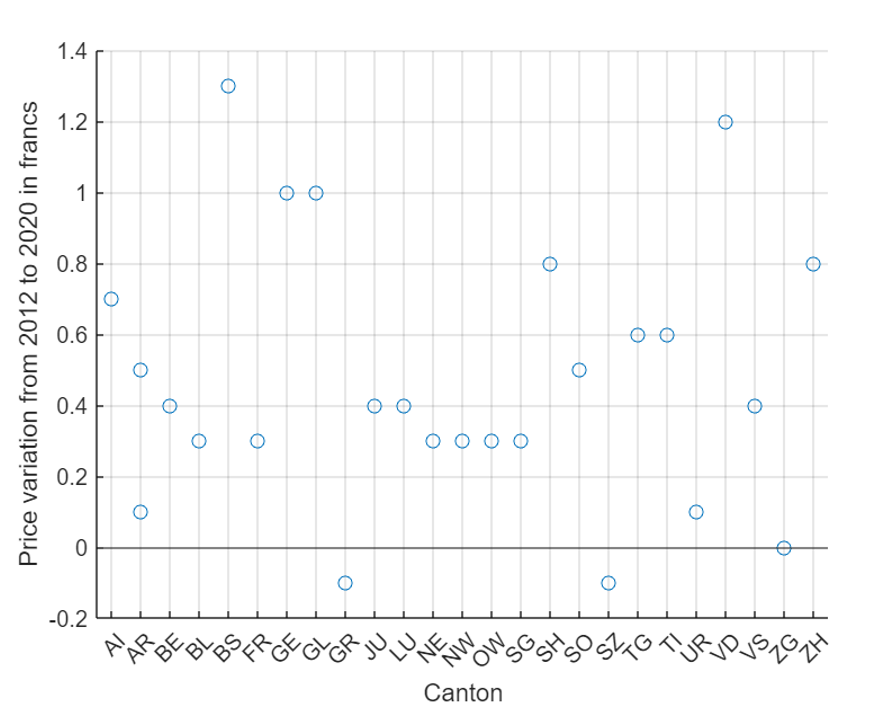
To have a better understanding, difference between 2012 and 2020 prices is summarized and plotted as follow:
Conclusion

The highest price deviation are the AI, Appenzeller Inner, second places is for BS, Basel City and third place is GL, Glarus cantons. . On the other hand, Basel Stadt has the higher variation in the prices, passing from 16.90 chf/m2 to 18.2 chf/m2.

Zurich city which has the highest population increase during the last 20 years, don’t show a proporcional increase in the price, passing 18.5 to 19.3 chf/m2.

A note from last graph is about zug that the price does not changes over 8 years, while Grisons and Schwyz the prices are lower the befor

It is worth to recall that prices are on average basis for all houses present in the canton and the price is referred only to rent, other expenses are not included like common heating, waste, cleaning, parking and other amenities.

Population-and-houses-growth-in-Switzerland

Average rent in Swiss francs according to the number of rooms and the canton | opendata.swiss

Demographic evolution, 1950-2021 | opendata.swiss

Average rent per m2 in Swiss francs according to the age of construction and the canton | opendata.swiss

Hydrogen Generation Due to High Voltage in Cathodic Protection

Introduction

Cathodic protection is a widely used technique to prevent corrosion of metal structures in various industrial applications. The process involves making the metal structure cathodic with respect to a more easily corroded metal or an inert anode. This results in a flow of current, which causes the metal to be protected from corrosion. However, cathodic protection can also lead to the generation of hydrogen gas, which can cause hydrogen embrittlement.

Technical Background

When cathodic protection is applied, a voltage is applied to the metal structure, which is more negative than the equilibrium potential of the metal in the electrolyte. This negative potential causes a flow of electrons from the anode to the cathode. At the cathode, hydrogen ions are reduced to form hydrogen gas. This is a normal process in cathodic protection, but at high potentials, the amount of hydrogen generated can be excessive and lead to hydrogen embrittlement.

Hydrogen embrittlement occurs when hydrogen diffuses into the metal and interacts with the metal lattice. This can reduce the ductility and fracture toughness of the metal, making it more susceptible to cracking and failure. The severity of hydrogen embrittlement depends on factors such as the material, the level of hydrogen exposure, and the applied stress.

History

Hydrogen embrittlement was first observed in the mid-19th century in steel rails used in railway tracks. The rails were observed to fracture suddenly, even though they had not been subjected to excessive loads. It was later discovered that the rails had been exposed to hydrogen gas, which had caused them to become brittle and prone to fracture. Since then, hydrogen embrittlement has been observed in various other metals and alloys.

Mitigation Strategies

To mitigate the risk of hydrogen embrittlement in cathodic protection, several strategies can be employed. One approach is to limit the amount of hydrogen generated at the cathode by using lower cathodic potentials or adding inhibitors to the electrolyte. Another approach is to use materials that are less susceptible to hydrogen embrittlement, such as high-strength alloys or titanium.

Post-processing techniques can also be used to remove or reduce the amount of hydrogen in the material. For example, annealing or heat treatment can be used to diffuse the hydrogen out of the metal. Additionally, hydrogen diffusion barriers can be applied to prevent hydrogen from entering the metal in the first place.

Conclusion

In conclusion, cathodic protection is an effective method to prevent corrosion of metal structures, but it can also lead to the generation of hydrogen gas and subsequent hydrogen embrittlement. To mitigate the risk of hydrogen embrittlement, it is important to limit the amount of hydrogen generated at the cathode and use materials that are less susceptible to hydrogen embrittlement. Regular inspections and proactive corrosion management are crucial to detecting any signs of hydrogen embrittlement or other types of corrosion damage.

References:

  • H. Wang, J. Zheng, Q. Zhang, & Y. Wei. (2019). Mitigation of hydrogen embrittlement of a 7B04 aluminum alloy by controlling the microstructure. Materials & Design, 170, 107675.
  • M. W. Kendig & R. G. Buchheit. (2003). Hydrogen embrittlement. Corrosion: Understanding the Basics, 305-324.
  • J. R. Scully & H. Zhu. (2010). Hydrogen embrittlement and hydrogen-induced cracking. ASM Handbook, 13B, 1085-1101.

Sentiment Analysis, how to sell more and better

Sentiment analysis is a powerful tool that can be used to analyze and understand the emotions, opinions, and attitudes expressed in a text or speech. This technology has gained significant importance in recent years as it helps businesses to understand customer feedback and sentiment, which can ultimately help them to make better decisions.

In this article, we will explore the techniques used in sentiment analysis and how it can help the retail industry.

What is Sentiment Analysis?

Sentiment analysis, also known as opinion mining, is a process that uses natural language processing, machine learning, and other computational techniques to identify and extract subjective information from text or speech data. It involves classifying the sentiment of a piece of text into positive, negative, or neutral categories.

The techniques used in sentiment analysis can vary from simple rule-based methods to more advanced machine learning algorithms. The most common approach is to use a combination of both methods.

Techniques used in Sentiment Analysis

Rule-based Methods
Rule-based methods rely on a set of predefined rules to classify sentiment in text. These rules can be based on specific words, phrases, or patterns that are associated with a particular sentiment. For example, if a sentence contains words like ‘good,’ ‘great,’ or ‘excellent,’ it is likely to be classified as positive.

While rule-based methods are simple and easy to implement, they can be less accurate than more advanced machine learning algorithms. They also require constant updating as language and expressions change over time.

Machine Learning
Machine learning algorithms use statistical models to learn from data and make predictions. These algorithms require a large dataset of labeled examples to train the model. The labeled data consists of text or speech samples, along with their corresponding sentiment labels.

There are several types of machine learning algorithms used in sentiment analysis, including:

Naive Bayes: This algorithm uses probabilistic models to classify text based on the frequency of words in the document.
Support Vector Machines (SVM): SVM is a supervised learning algorithm that can classify text into two or more categories based on the features extracted from the text.
Deep Learning: Deep learning techniques such as Convolutional Neural Networks (CNN) and Recurrent Neural Networks (RNN) can be used to learn complex patterns and relationships in text data.
How Sentiment Analysis Can Help the Retail Industry

The retail industry is one of the most competitive industries in the world, and understanding customer feedback and sentiment is crucial for success. Sentiment analysis can help retailers in several ways:

Customer Feedback Analysis

Sentiment analysis can be used to analyze customer feedback and reviews from various sources such as social media, review sites, and customer surveys. This information can help retailers to identify areas of improvement and make changes accordingly. For example, if customers are complaining about the long checkout lines, retailers can take steps to improve the checkout process and reduce wait times.

Product Development

Sentiment analysis can be used to analyze customer feedback on existing products and services. Retailers can use this information to identify areas for improvement or to develop new products that better meet the needs of their customers.

Brand Management

Sentiment analysis can be used to monitor brand reputation and identify potential issues before they become major problems. By analyzing social media conversations and other online content, retailers can track customer sentiment and respond quickly to any negative feedback.

Customer Service

Sentiment analysis can be used to monitor customer service interactions and identify areas where improvements can be made. By analyzing customer feedback and sentiment, retailers can improve the quality of customer service and enhance the overall customer experience.

Conclusion

Sentiment analysis is a powerful tool that can help the retail industry to understand customer feedback and sentiment. By analyzing customer feedback and sentiment, retailers can identify areas for improvement, develop new products, and enhance the overall customer experience. With the increasing availability of data and the advancements in machine learning algorithms, sentiment analysis has become more accurate and efficient. Retailers can now use sentiment analysis tools to process vast amounts of customer feedback and sentiment data in real-time, enabling them to make better business decisions quickly.

In addition to the benefits discussed above, sentiment analysis can also be used to analyze competitor data, track industry trends, and identify emerging market opportunities. By leveraging sentiment analysis, retailers can gain valuable insights into their customers’ needs and preferences, allowing them to stay ahead of the competition and adapt to changing market conditions.

However, it is important to note that sentiment analysis is not a perfect tool and can be affected by biases and inaccuracies in the data. For example, sarcasm and irony can be challenging to detect, and sentiment analysis tools may struggle to identify subtle nuances in language and context.

To mitigate these challenges, retailers should use a combination of sentiment analysis tools and human analysis to ensure the accuracy and relevance of their insights. By combining the power of technology with the expertise of human analysts, retailers can gain a deeper understanding of customer sentiment and make better decisions that drive business growth.

In conclusion, sentiment analysis is a powerful technology that can help the retail industry to understand customer sentiment and feedback. By leveraging sentiment analysis, retailers can gain valuable insights into their customers’ needs and preferences, allowing them to make better decisions and improve customer satisfaction.

How Machine Learning can save money in tomorrow’s industry

The oil and gas industry is constantly looking for ways to improve the efficiency of its operations and reduce downtime. One way to achieve this is through predictive maintenance, which uses machine learning algorithms to identify potential equipment failures before they occur. This article will explore the advantages and disadvantages of using machine learning for predictive maintenance in the oil and gas industry.

Advantages of Machine Learning for Predictive Maintenance in the Oil and Gas Industry

  1. Improved Equipment Performance

Machine learning algorithms can analyze real-time data to predict equipment failures before they occur. This allows companies to schedule maintenance proactively, resulting in improved equipment performance and reliability. By predicting when maintenance is needed, companies can avoid costly and time-consuming downtime.

  1. Reduced Downtime

Downtime can be costly for any industry, but it is especially significant in the oil and gas industry, where every minute of downtime can result in lost revenue. Predictive maintenance can help reduce downtime by identifying potential equipment failures before they occur. By preventing equipment failures, companies can avoid the costly downtime associated with repairs.

  1. Increased Safety

Predictive maintenance can help improve safety by identifying potential equipment failures before they occur. This can help prevent accidents and improve overall safety in the workplace. By identifying potential safety hazards, companies can take proactive steps to prevent accidents and keep their employees safe.

  1. Reduced Maintenance Costs

Predictive maintenance can help reduce maintenance costs by allowing companies to schedule maintenance only when it is necessary. This can reduce the need for unnecessary maintenance, which can be costly. By predicting when maintenance is needed, companies can avoid costly repairs and reduce their overall maintenance costs.

Disadvantages of Machine Learning for Predictive Maintenance in the Oil and Gas Industry

  1. Cost

Implementing machine learning algorithms can be expensive, especially for small to medium-sized companies. It may require significant investment in new hardware and software, as well as training for employees. However, the cost of implementing machine learning for predictive maintenance must be weighed against the potential cost savings from reduced downtime and maintenance costs.

  1. Data Quality

Predictive maintenance relies on high-quality data to produce accurate results. If the data is incomplete or inaccurate, the algorithms may produce inaccurate predictions, leading to unnecessary maintenance or equipment failure. To overcome this challenge, companies must ensure that they have high-quality data and that their algorithms are properly calibrated.

  1. Complexity

Machine learning algorithms can be complex, and it may be difficult for non-experts to understand how they work. This can make it challenging to implement and maintain the algorithms. To overcome this challenge, companies must ensure that they have skilled data analysts who can develop and maintain the algorithms.

  1. Need for Skilled Data Analysts

Machine learning algorithms require skilled data analysts to develop and maintain them. These experts can be difficult to find and expensive to hire, which can be a significant barrier to implementing predictive maintenance. Companies must ensure that they have the necessary resources to develop and maintain their algorithms.

Conclusion

The advantages of using machine learning for predictive maintenance in the oil and gas industry are clear. Improved equipment performance, reduced downtime, increased safety, and reduced maintenance costs can all be achieved through the use of these algorithms. However, the disadvantages, such as cost, data quality, complexity, and the need for skilled data analysts, must also be considered. Overall, the benefits of using machine learning for predictive maintenance in the oil and gas industry outweigh the drawbacks, making it an attractive option for companies looking to improve their operations. To successfully implement predictive maintenance using machine learning, companies must ensure that they have the necessary resources and expertise to develop and maintain their algorithms.

Data Scientist: Current State and Future Trend, a new role for the future

The field of data science has exploded in recent years, with demand for skilled professionals at an all-time high. Universities around the world now offer a variety of courses and degree programs in data science, including both undergraduate and graduate options. Online learning platforms such as Coursera, Udacity, and edX offer massive open online courses (MOOCs) in data science, allowing individuals to gain valuable knowledge and skills without enrolling in a full-time program.

While many universities and online courses provide a solid foundation in data science, heuristic knowledge gained through practical experience is equally important. Data scientists must have strong programming skills, as well as expertise in statistical analysis, machine learning, and data visualization. Effective communication skills are also essential, as data scientists must be able to explain their findings to both technical and non-technical stakeholders.

Some minimum requirements for a career in data science include a bachelor’s degree in a related field such as computer science, statistics, or mathematics, as well as experience with programming languages such as Python or R. However, many employers now require advanced degrees and significant work experience in the field.

According to the Bureau of Labor Statistics, the demand for data scientists is projected to grow by 16% between 2020 and 2030. This growth is expected to be driven by increasing demand for data-driven decision-making across industries. The field of data science is continually evolving, and professionals must keep up with the latest developments and technologies to stay competitive.

In addition to traditional data science roles, there are also emerging areas of specialization within the field, such as data engineering, data visualization, and data journalism. These specializations offer opportunities for individuals to focus on specific aspects of data science and develop expertise in a particular area.

In conclusion, data science is a rapidly growing field with strong demand for skilled professionals. While universities and online courses provide a foundation, practical experience and heuristic knowledge are equally important. Effective communication and programming skills are essential, and advanced degrees and work experience are increasingly required. With the continued growth of data-driven decision-making, the demand for data science professionals is expected to remain high.

Key Distinctions between Scientists and Engineer, to empower Data Analytics

Data analytics is a growing field, where data scientists and engineers are crucial for its success. Both roles involve working with data, but have distinct responsibilities. Science is more like research, while data engineering is more like development. The first analyze data to extract insights and make predictions, while data engineers design and maintain systems to enable data scientists to work with data.

Data scientists ask the right questions and find meaningful insights from data, while data engineers build and maintain the infrastructure. Engineering involves building the infrastructure to support data science, while data science involves using that infrastructure to extract insights to make data usable, while data science makes sense of it.

Both data scientists and data engineers have strong employment prospects. The demand for data scientists is projected to grow by 16% between 2020 and 2030, and for computer and information technology occupations, which include data engineers, by 11%. The increasing importance of data-driven decision making across industries means that the demand for both roles will continue to rise.

If you want to become a data engineer or data scientist, there are various educational paths to take. Many universities offer undergraduate and graduate programs in data science, computer science, or related fields. Additionally, various online courses and bootcamps offer training in data analytics, machine learning, and other relevant skills.

Data science and data engineering have vast and varied applications. In healthcare, data analytics improves patient outcomes and streamlines processes. In finance, data analytics detects fraud and predicts market trends. In retail, data analytics personalizes marketing campaigns and optimizes supply chain operations. Data science and data engineering drive innovation and create value across industries.

Conclusion

In conclusion, data scientists and data engineers are critical for data analytics success, with essential, distinct responsibilities. The demand for both roles will continue to increase, as data-driven decision making becomes more important. Pursuing a career in data analytics offers various educational paths and fields of application to explore.

Further resources

  1. “Python Data Science Handbook” by Jake VanderPlas: https://jakevdp.github.io/PythonDataScienceHandbook/
  2. “Data Science Essentials” by Microsoft: https://docs.microsoft.com/en-us/learn/paths/data-science-essentials/
  3. “Data Engineering Cookbook” by O’Reilly Media: https://www.oreilly.com/library/view/data-engineering-cookbook/9781492071424/
  4. “Data Science for Business” by Foster Provost and Tom Fawcett: https://www.amazon.com/Data-Science-Business-data-analytic-thinking/dp/1449361323
  5. “Data Engineering on Google Cloud Platform” by Google Cloud: https://cloud.google.com/solutions/data-engineering/
  6. “Applied Data Science with Python” by Coursera: https://www.coursera.org/specializations/data-science-python

Supervised, Unsupervised & Reinforced Learning, a quick intro!

In the field of predictive maintenance for rotating equipment, machine learning algorithms can be classified into three categories: supervised learning, unsupervised learning, and reinforced learning. Each of these approaches has its strengths and weaknesses, and choosing the right approach depends on the nature of the problem at hand. In this essay, we will explore the differences between these approaches and their applications in the context of predictive maintenance for rotating equipment.

Supervised Learning

Supervised learning involves training a model on labeled data, where both the input data and the desired output are provided. The goal is to learn a function that can predict the output for new, unseen input data. In the context of predictive maintenance for rotating equipment, supervised learning can be used to predict the remaining useful life of a machine or to detect anomalies that may indicate the onset of a fault.

One common application of supervised learning in predictive maintenance is to analyze vibration data from rotating machinery. By training a model on labeled data that indicates when a fault occurred and the corresponding vibration patterns, the algorithm can learn to identify these patterns in real-time data and predict potential faults before they occur.

Unsupervised Learning

Unsupervised learning involves training a model on unlabeled data, where the input data is provided without any corresponding output. The goal is to find patterns or structures in the data that can be used to make predictions or identify anomalies. In the context of predictive maintenance for rotating equipment, unsupervised learning can be used to identify patterns or clusters in sensor data that may indicate the presence of a fault.

One common application of unsupervised learning in predictive maintenance is to use clustering algorithms to group similar data points together. By analyzing the clusters, it may be possible to identify patterns that are indicative of a specific type of fault or to detect anomalies that may indicate the onset of a fault.

Reinforced Learning

Reinforcement learning involves training a model to make decisions based on feedback from the environment. The goal is to learn a policy that maximizes a reward signal over time. In the context of predictive maintenance for rotating equipment, reinforced learning can be used to develop maintenance schedules that minimize downtime and reduce costs.

One common application of reinforced learning in predictive maintenance is to use a model to determine when maintenance should be performed based on the condition of the machine and the cost of downtime. By learning a policy that balances the cost of maintenance with the cost of downtime, it may be possible to develop a more efficient maintenance schedule that reduces costs and increases efficiency.

Choosing the Right Approach

The choice of machine learning approach depends on the nature of the problem at hand. Supervised learning is best suited for problems where labeled data is available, and the goal is to predict an output for new, unseen data. Unsupervised learning is best suited for problems where the data is not labeled, and the goal is to identify patterns or anomalies in the data. Reinforced learning is best suited for problems where the goal is to develop a policy that maximizes a reward signal over time.

In the context of predictive maintenance for rotating equipment, a combination of these approaches may be used to develop a comprehensive predictive maintenance strategy. For example, supervised learning can be used to predict the remaining useful life of a machine, unsupervised learning can be used to identify patterns or clusters in sensor data, and reinforced learning can be used to develop a maintenance schedule that balances the cost of maintenance with the cost of downtime.

Conclusion

In conclusion, machine learning algorithms can be classified into three categories: supervised learning, unsupervised learning, and reinforced learning. Each of these approaches has its strengths and weaknesses, and choosing the right approach depends on the nature of the problem at hand. In the context of predictive maintenance for rotating equipment, a combination of these approaches may be used to develop a comprehensive predictive maintenance strategy that minimizes downtime, reduces costs