100 Liters of Petroleum, from fuel to petrochemicals
Petroleum, a finite and precious resource, holds within its depths a treasure trove of products that have revolutionized modern society. From fuelling our vehicles to powering industries and shaping everyday objects, petroleum’s versatility is undeniable. However, the extraction, processing, and utilization of petroleum come with significant environmental implications that demand our attention. In this article, we delve into the diverse products obtainable from 100 liters of petroleum and explore their multifaceted impacts on the environment.
Gasoline and Diesel: The Workhorses of Transportation
A substantial portion of 100 liters of petroleum is transformed into gasoline and diesel, the lifeblood of the transportation sector. These fuels power our cars, trucks, and buses, enabling mobility and facilitating commerce. However, their combustion releases harmful pollutants, including carbon monoxide, nitrogen oxides, and particulate matter, contributing to air pollution and respiratory health issues. Additionally, the extraction and transportation of crude oil for gasoline and diesel production can lead to oil spills and habitat destruction, jeopardizing marine ecosystems.
Plastics: Ubiquitous Yet Problematic
A significant volume of petroleum is dedicated to the production of plastics, a ubiquitous material found in countless products, from packaging to clothing and electronics. Plastics have revolutionized various industries due to their durability, versatility, and low cost. However, their environmental footprint is substantial. The production of plastics contributes to greenhouse gas emissions, and their disposal often leads to plastic pollution in landfills, oceans, and waterways. The slow degradation rate of plastics poses a threat to wildlife, marine life, and human health.
Heating Oil: A Winter Necessity
Petroleum is also refined into heating oil, a crucial fuel for homes and businesses in colder climates. It provides warmth during the winter months, but its combustion emits air pollutants, including sulphur dioxide and particulate matter, contributing to smog and acid rain. Furthermore, the extraction, transportation, and storage of heating oil carry the risk of spills and leaks, potentially contaminating soil and water resources.
Lubricants: Ensuring Smooth Operation
A portion of petroleum is used to produce lubricants, essential for reducing friction and wear in engines, machinery, and industrial equipment. Lubricants help extend the lifespan of mechanical components and contribute to efficient operation. However, they can pose environmental risks if not properly disposed of. Improper disposal practices can lead to soil and water contamination, as well as harm to aquatic life.
Asphalt: Paving the Way for Infrastructure
Asphalt, a key component of road construction, is derived from petroleum. It provides a durable and smooth surface for transportation infrastructure, facilitating the movement of people and goods. However, asphalt production and paving release volatile organic compounds (VOCs), which contribute to air pollution and can have adverse effects on human health and the environment.
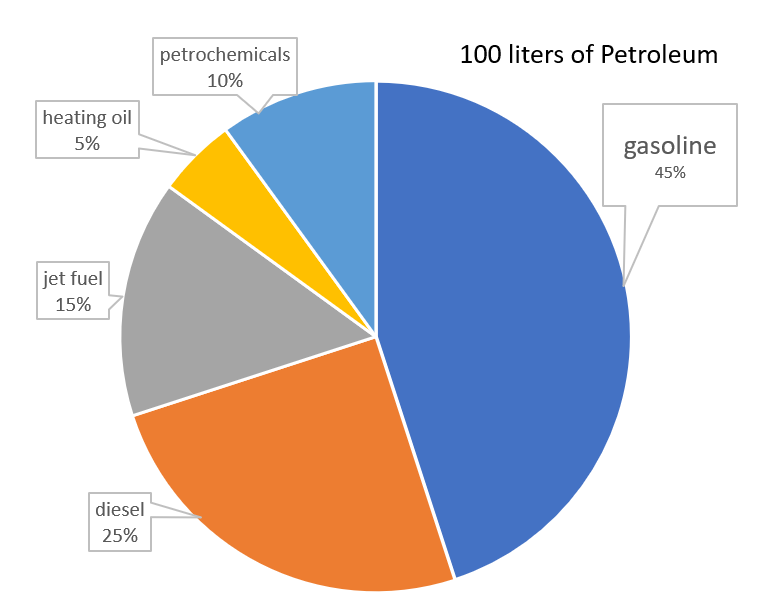
Gasoline: Approximately 45-50 liters of gasoline can be obtained from 100 liters of petroleum. Gasoline is a primary fuel used in internal combustion engines, powering vehicles such as cars, trucks, and motorcycles.
Diesel: Around 25-30 liters of diesel can be produced from 100 liters of petroleum. Diesel is commonly used in heavy-duty vehicles like trucks, buses, and construction equipment due to its higher energy density and efficiency.
Jet Fuel: Approximately 10-15 liters of jet fuel can be derived from 100 liters of petroleum. Jet fuel is specifically designed for powering aircraft engines, providing the necessary energy and stability for flight.
Heating Oil: About 5-10 liters of heating oil can be obtained from 100 liters of petroleum. Heating oil is commonly used as a fuel source for residential and commercial heating systems, providing warmth during colder months.
Petrochemicals: The remaining 10-15 liters of petroleum can be processed into various petrochemicals, which serve as building blocks for a wide range of products. These petrochemicals include plastics, synthetic fibers, fertilizers, solvents, and pharmaceuticals.
It’s important to note that the exact proportions of these products obtained from 100 liters of petroleum can vary depending on the specific refining process and the desired end products.
Some of them are used to produce several derivatives that are now a part of our daily life, and can be listed as follows:
Ethylene: Production of polyethylene (plastic bags, bottles, films), ethylene oxide (ethylene glycol, antifreeze), and vinyl chloride (PVC).
Propylene: Production of polypropylene (plastic containers, fibers), propylene oxide (polyurethane foams), and acrylic acid (acrylic fibers).
Butylene: Production of butyl rubber (tires, inner tubes), and isobutylene (methyl tert-butyl ether, a gasoline additive).
Benzene: Production of styrene (polystyrene, plastic cups, disposable plates), cumene (phenol, acetone), and cyclohexane (nylon).
Toluene: Production of benzene, toluene diisocyanate (TDI, polyurethane foams), and toluene-2,4-diamine (TDA, aramid fibers).
Xylene: Production of polyester fibers, polyethylene terephthalate (PET, plastic bottles, films), and dimethyl terephthalate (DMT, a precursor to PET).
Refinery Gas: Fuel for cooking, heating, and industrial processes.
Naphtha: Feedstock for steam crackers to produce ethylene, propylene, and other petrochemicals.
Kerosene: Fuel for jet engines, lamps, and heating.
Diesel: Fuel for trucks, buses, and other heavy-duty vehicles.
Fuel Oil: Fuel for ships, boilers, and industrial furnaces.
Lubricants: Reduce friction and wear in engines, gears, and other moving parts.
Asphalt: Paving roads, roofing materials, and waterproofing.
Petrochemical Feedstocks: Raw materials to produce plastics, synthetic fibres, and other petrochemical products.
From the point of view of energy consumption the amount of kWh needed to produce 100 liters of gasoline from petroleum can vary depending on the specific process and technology used. However, a rough estimate can be provided based on typical industry practices.
Crude Oil Distillation: The first step in gasoline production is the distillation of crude oil. This process involves heating the crude oil to a high temperature and separating it into various fractions, including gasoline, diesel, and other products. The amount of energy required for distillation depends on the size and efficiency of the distillation unit, but it typically ranges from 0.1 to 0.3 kWh per liter of crude oil.
Gasoline Blending: After distillation, the gasoline fraction is blended with various additives to improve its performance and meet specific quality standards. This blending process typically requires minimal energy, usually less than 0.01 kWh per liter of gasoline.
Reforming: To increase the octane number and improve the quality of gasoline, it often undergoes a reforming process. Reforming involves converting low-octane components into high-octane ones through chemical reactions. The energy required for reforming can vary depending on the severity of the process, but it typically ranges from 0.2 to 0.5 kWh per liter of gasoline.
Other Processes: In addition to the above steps, gasoline production may involve other processes such as desulfurization, isomerization, and alkylation. These processes aim to remove impurities, improve octane number, and optimize the overall quality of gasoline. The energy required for these processes can vary, but it is generally lower compared to the main steps mentioned above.
Considering all these factors, a reasonable estimate for the total kWh required to produce 100 liters of gasoline from petroleum is approximately 10 to 20 kWh. This range takes into account the energy needed for crude oil distillation, gasoline blending, reforming, and other typical processes involved in gasoline production. It is important to note that this estimate may vary depending on specific refinery configurations, process efficiencies, and the quality of the crude oil being processed.
Electrical cars are slowly having a place in the daily life of citizens, and the technology progress is helping to achieve or extend autonomy of batteries. On the other hand, endothermic cars still playing an important role in the fuel consumption, but if all the cars in world were electric, there will be a surplus of gasoline/diesel.
It is possible to transform gasoline into petrochemicals ?
Yes, it is possible to transform gasoline into petrochemicals. Petrochemicals are chemical compounds derived from petroleum or natural gas, and gasoline is a refined product of crude oil. The process of converting gasoline into petrochemicals is called reforming.
Reforming is a chemical process that involves heating gasoline in the presence of a catalyst, such as platinum or rhenium. This causes the gasoline molecules to break down and rearrange, forming new molecules that are more useful as petrochemicals. The most common petrochemicals produced by reforming are ethylene, propylene, and benzene.
Ethylene and propylene are used to make plastics, synthetic fibers, and other chemicals. Benzene is used to make plastics, dyes, and detergents.
The reforming process can be used to convert a variety of different types of gasoline into petrochemicals. The type of gasoline used will affect the yield and composition of the petrochemicals produced.
Reforming is an important process in the petrochemical industry. It allows refineries to convert gasoline, which is a relatively low-value product, into more valuable petrochemicals. These petrochemicals are used to make a wide variety of products that we use every day.
Here is a more detailed explanation of the reforming process:
1. The gasoline is heated to a high temperature, typically between 500 and 600 degrees Celsius.
2. The heated gasoline is passed over a catalyst, which is a material that helps to speed up the chemical reaction.
3. The catalyst causes the gasoline molecules to break down and rearrange, forming new molecules.
4. The new molecules are cooled and condensed into a liquid.
5. The liquid is then separated into its individual components, such as ethylene, propylene, and benzene.
The reforming process is a complex one, but it is essential for the production of petrochemicals. Without reforming, we would not be able to make many of the products that we rely on every day.
How many kWh are needed to transform gasoline in petrochemicals?
The amount of kWh needed to transform gasoline into petrochemicals can vary depending on the specific petrochemicals being produced, the efficiency of the conversion process, and the energy source used. However, as a general estimate, it takes approximately 10-12 kWh of electricity to produce 1 kg of petrochemicals from gasoline.
For example, to produce 1 kg of ethylene from gasoline, which is a common petrochemical used to make plastics, it would require approximately 10-12 kWh of electricity. This electricity is used to power the various processes involved in the conversion, such as heating, cooling, and separation.
It’s important to note that the energy required for petrochemical production can also vary depending on the type of gasoline being used. For instance, gasoline with a higher-octane rating may require more energy to convert into petrochemicals compared to gasoline with a lower octane rating.
Additionally, the efficiency of the conversion process plays a significant role in determining the energy consumption. More efficient processes, such as those that utilize advanced technologies or optimize energy usage, can reduce the amount of electricity needed to produce the same amount of petrochemicals.
Overall, the energy consumption for transforming gasoline into petrochemicals is a complex issue that depends on various factors. However, as a rough estimate, it takes approximately 10-12 kWh of electricity to produce 1 kg of petrochemicals from gasoline.
Conclusion
The diverse products obtained from 100 liters of petroleum have indelibly shaped modern society, providing convenience, mobility, and numerous essential goods. However, their production and use come with significant environmental consequences.
If not needed for fuel, petroleum is needed as raw material to produce several products that are essential for our daily life, directly or indirectly. Transition from endothermic to electric car of course plays an important role in reducing CO2 emission, but at the same time this create a surplus in gasoline that should be than transformed to petrochemicals. This excess should be considered when considering energy transition.