This article was done to get some statistics about rock music and what big data analysis can do to gather or discover hidden useful information.
The following analysis gets the data from Kaggle, free license
What is Kaggle? According to online definitions, Kaggle, a subsidiary of Google LLC, is an online community of data scientists and machine learning practitioners. inside the website can be found courses, datasets, contest/challenges including money.
Dataset can be uploaded by single usernames or by companies during a competition.
Scope of the Study
A lot of considerations can be made from the history of rock music, but the scope of this study is to support the changes that music rock did during the years.
Rock music, as an alternative of pop music (intended as common or soft) in the beginning was an underground music that gained fame during the years, with a constant increase. Some people or critics claim that rock is dead, but we will seek if there is a truth on this sentence.
Data
Dataset is from 2020 retrieved from spotify covering rock songs from 1950 to 2020 with 5484 songs and 17 tags/label to identify and classify a song. From the tag list, only popularity is an index from the audience feedback while the remaining tags describe the song characteristics.
- Index
- Name: Song’s name
- Artist
- Release date
- Length: in minutes
- Popularity: A value from 0 to 100
- Danceability: Describes how suitable a track is for dancing based on a combination of musical elements including tempo, rhythm stability, beat strength, and overall regularity.
- Acousticness: A confidence measure from 0.0 to 1.0 of whether the track is acoustic.
- Energy: Represents a perceptual measure of intensity and activity. Typically, energetic tracks feel fast, loud, and noisy. For example, death metal has high energy, while a Bach prelude scores low on the scale.
- Instrumentalness: Predicts whether a track contains no vocals. “Ooh” and “aah” sounds are treated as instrumental in this context. Rap or spoken word tracks are clearly “vocal”.
- Key: The estimated overall key of the track. Integers map to pitches using standard Pitch Class notation . E.g. 0 = C, 1 = C♯/D♭, 2 = D, and so on.
- Liveness: Detects the presence of an audience in the recording. Higher liveness values represent an increased probability that the track was performed live.
- Loudness: The overall loudness of a track in decibels (dB). Loudness values are averaged across the entire track and are useful for comparing relative loudness of tracks.
- Speechiness: This detects the presence of spoken words in a track. The more exclusively speech-like the recording (e.g. talk show, audio book, poetry), the closer to 1.0 the attribute value.
- Tempo: The overall estimated tempo of a track in beats per minute (BPM). In musical terminology, tempo is the speed or pace of a given piece and derives directly from the average beat duration.
- Time Signature: An estimated overall time signature of a track. The time signature (meter) is a notational convention to specify how many beats are in each bar (or measure).
- Valence: Describes the musical positiveness conveyed by a track. Tracks with high valence sound more positive (e.g. happy, cheerful, euphoric), while tracks with low valence sound more negative (e.g. sad, depressed, angry).
Popularity requires some clarification from analytical point of view and need some assumptions. We don’t know when the popularity was measured, monthly or yearly, and also in which year. Considering this lack of information, we will assume likelihood that popularity was calculed in 2020 when considering songs from 1950 to 2019.
Data Pre-processing & Feature Engineering
After loading the data, we need to manipulate it according to our scope of the study, more specifically we will count the letters both in the artist’s name and song’s name.
The name of the song contains some noise created by the versions mastered or remastered. this creates a distortion in the real name of the song. Most of time, remastering a song has the only effect to clean using new technologies and also to refresh the mind of people.
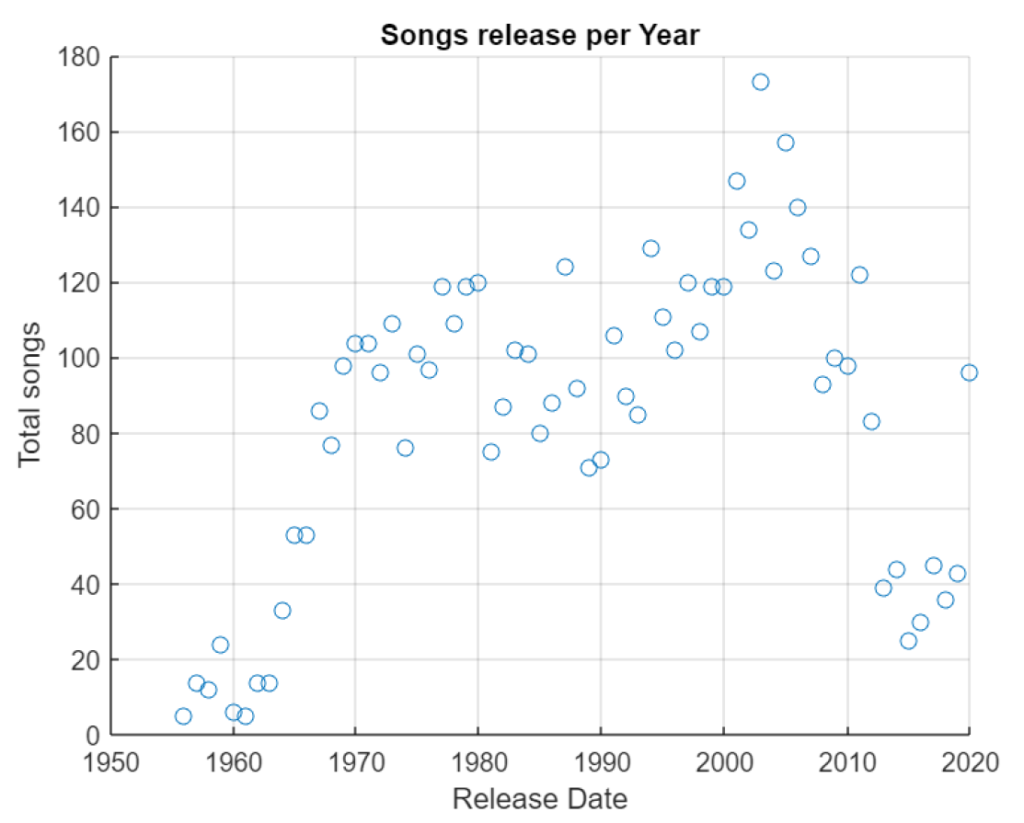
Since there are 5848 rows in the data, this creates a lot of noise, so the best way for filtering data, is to preprocesssing in aggregated way following statistical parameters, mean, max & min of the values for each year from 1956 to 2020. This leads to a new data set of 65 rows where every row is one year.
Below you can find complete pdf.
historyofrock
Please tell me more about this. May I ask you a question?
yes ask
I’d like to find out more? I’d love to find out more details.
this document was done by us using data available from spotify. If you read the pdf, you can find the complete description of the steps done
May I request more information on the subject? All of your articles are extremely useful to me. Thank you!