Data analysis of A vending machine can be very helpful because the information given after trasforming & visusalizing data can enhance logistics, avoid losses and improve performance.
A vending machine is one of those machines installed in shopping mall, offices and stores. They can sell anything which is inside. Any item is stored in a coil and can be bought at a fixed price.
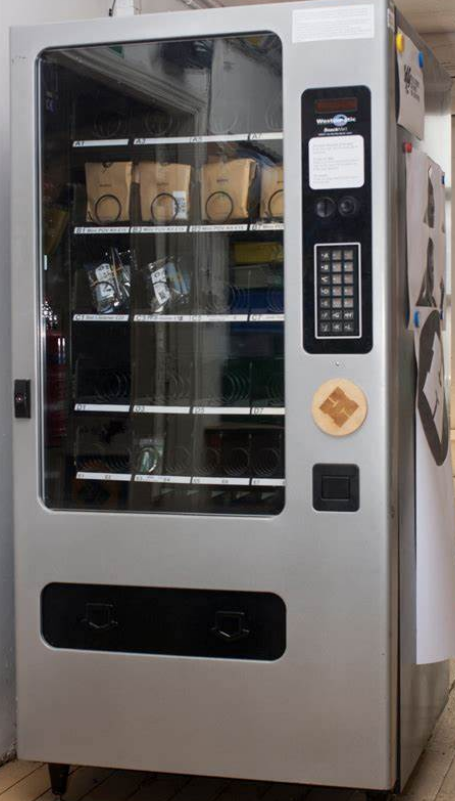
The new models allows to collects usefull data in csv format and then can be manipulated in a way that can give a lot of information like customer profile, spending, preferences and also to discover some correlation between two or more products are sold together.
This study collects data from a single vending machine and try to analyse and search for some correlation between items sold.
Data consist in a single file with 6445 rows and 16 columns. Rows corresponds to a a single operation, from January to August. Most important columns for this study correspond to:
- Name
- DateofSale: day,month, day number, year
- Type of Food: Carbonated, Non-Carbonated, Food, Water
- Type of Payment: credit card, cash
- RCoil: coil number of the product
- RPrice: price of the product in the coil
- QtySold: quantity sold
- TransTotal: total amount of the transaction. Normally 1 sold, 1 paid, but can happens that more than item can be sold
Preprocessing
Data is loaded as follow, removing unnecessary fields from raw data:
After cleaning and transforming data, the following table shows the entire dataset consisting of 6445 rows and 10 columns.
The first thing to do, is a preliminary calculation to see which categories are present in the dataset.
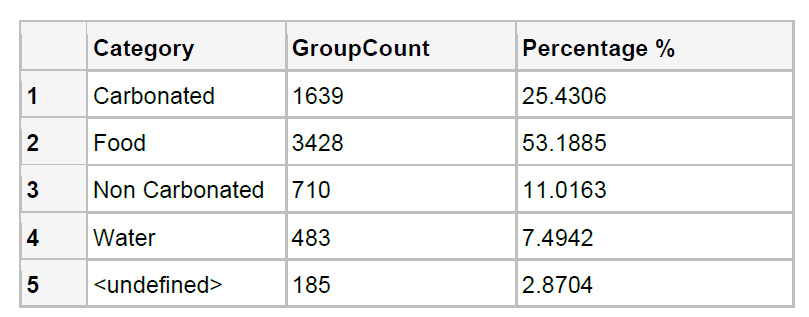
We can see that the 2 most important categories are food and carbonated drinks, which correspond to 78% of total transactions in 8 months of sampling. In the following sections we will go deep into data analytics
Carbonated
The following table corresponds Carbonated products and quantity sold, sorted from hightest to lowest:
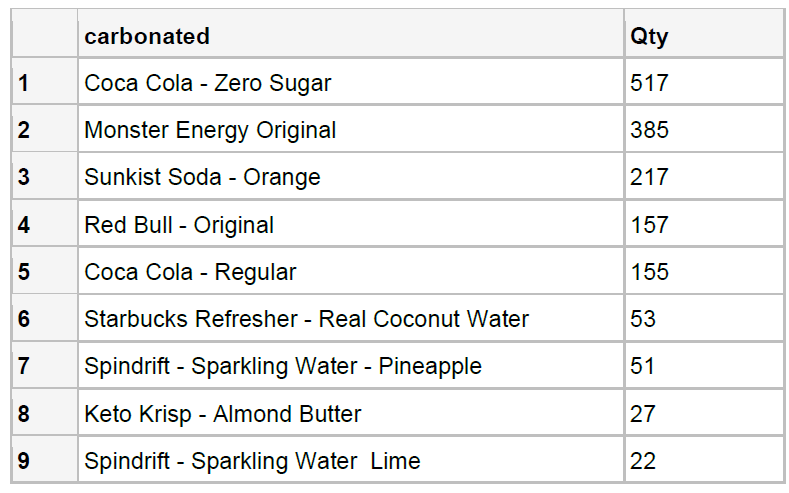
The first 5 positions, corresponding to 37% of the types of carbonated drink, sold 1431
Food
The following table corresponds Food products and quantity sold, sorted from hightest to lowest
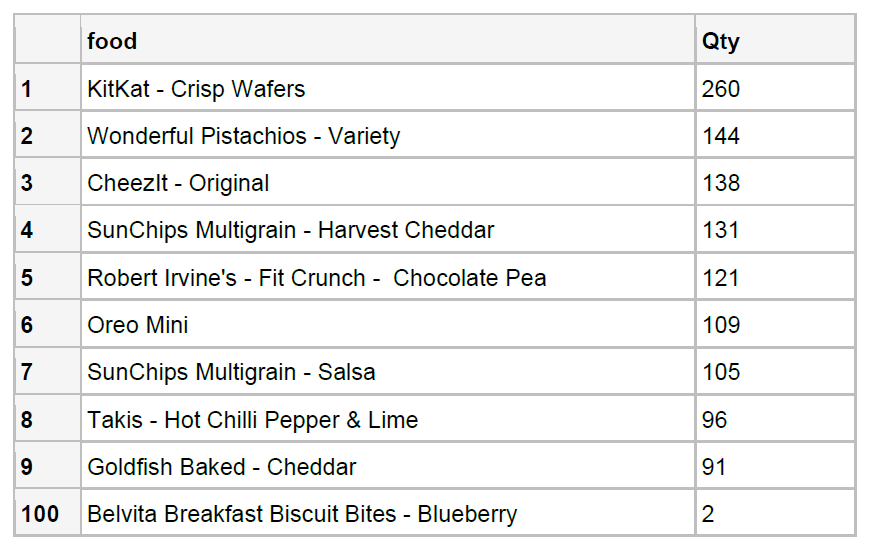
In case of food, the first 5 position covers only 23% of the total quantity sold, in addition to this the number of categories/brands is 7 times bigger than carbonated drinks. This creates a spread in the sales because the user/client has more types to choose. The above short section shown the data extracted from the main dataset that is usefull to provide an indication of trending products. The information given is without any statistical inference, but merely data extracted, loaded and transformed (ELT).
Monthly sales
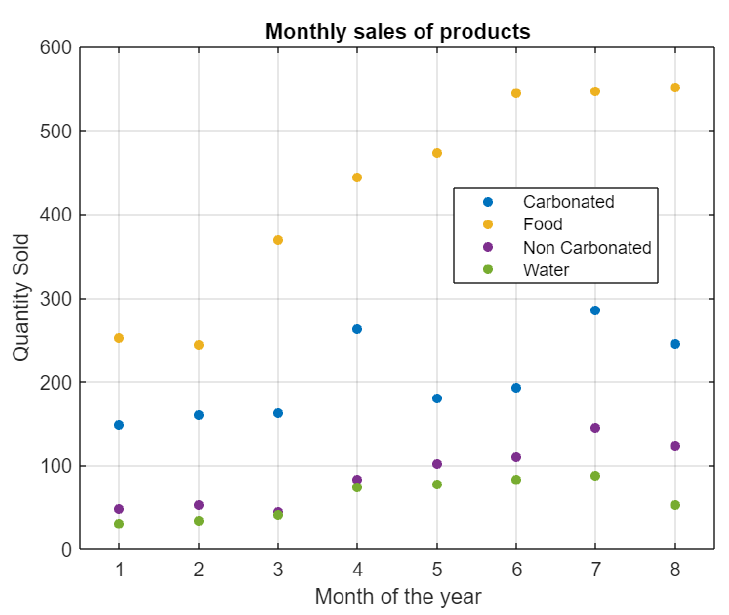
If you want to see the overall study and discover if there is a correlation between a carbonated drink is sold with food, you can find it below