Switzerland is known for its high standard of living and picturesque landscapes, making it a popular destination for expats, students, and travelers. However, it is also known for its high cost of living, including housing prices. Renting a flat in Switzerland can be expensive, especially in larger cities such as Zurich, Geneva, and Basel.
The scope of this article is a study to correlate the prices of the house in francs/m2 and correlating them with population. The data used is provided by opendata.swiss and the information of this paper is free of charge.
Data Mining & Preprocessing
All data used in this study was retrieved from opendata.swiss which is the Swiss public administration’s central portal for open government data.
Several files with CSV and XLS extensions were used and adapted to provide a full dataset of information regarding population growth, buildings construction and price variation through the years.
Population data set cover 1950-2020, classified by sex, provenience & canton
Building construction dataset on the other side starts in 2003 to 2020 classified by flat or building & canton
Last set is about price per m2 in swiss francs. This set starts in 2012 until 2020 classified by canton & year of construction, from older than 1919 up to 2021. For our purpose, average through canton value was used in order to homogenize data accross years and building age.
Population data was truncated to start in 2003 to match building construction data set.
Analysis
For the analysis few statistical indicatore were used:
- Arithmetic mean, also known as the average, is a measure of central tendency that represents the typical value of a set of numbers. It is calculated by adding up all the values in a set and then dividing the sum by the number of values in the set. The arithmetic mean is commonly used in statistics to summarize the data and to compare different sets of data. It is a useful measure of central tendency when the data is evenly distributed and does not have any extreme outliers. However, it can be influenced by outliers, and in such cases, other measures of central tendency such as the median or mode may be more appropriate. Defined as:
- Standard deviation, The standard deviation is a measure of the amount of variation or dispersion in a set of data. It is calculated as the square root of the variance, which is the average of the squared differences of each value from the mean. The standard deviation is commonly used in statistics to describe the spread of a distribution, with a higher standard deviation indicating a wider spread of values and a lower standard deviation indicating a narrower spread of values. It is also used in inferential statistics to calculate confidence intervals and to test hypotheses about the population from which the sample was drawn. Defined as:
After calculations, graphs were constructed to visualize data and get information.
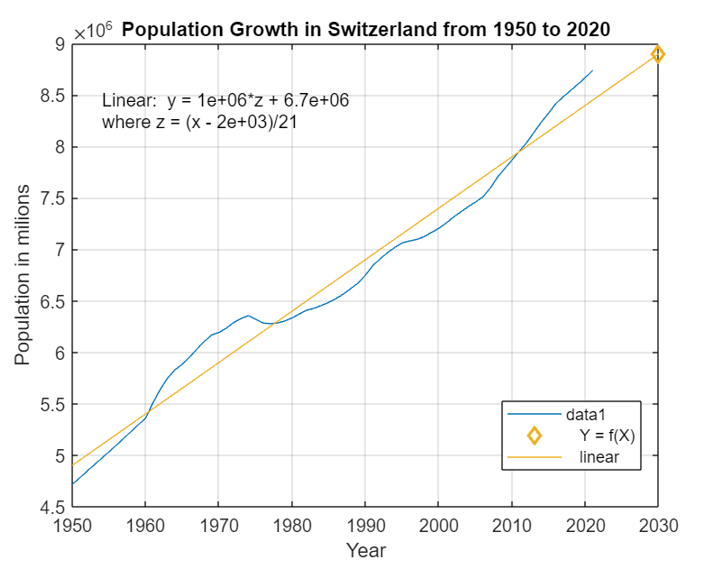
Population Data
Data recall population from year 1950 until 2020. After importing data, it is usefull to display visual information of total values both for sex and citizenship. The final graph after filtering data is as follows:
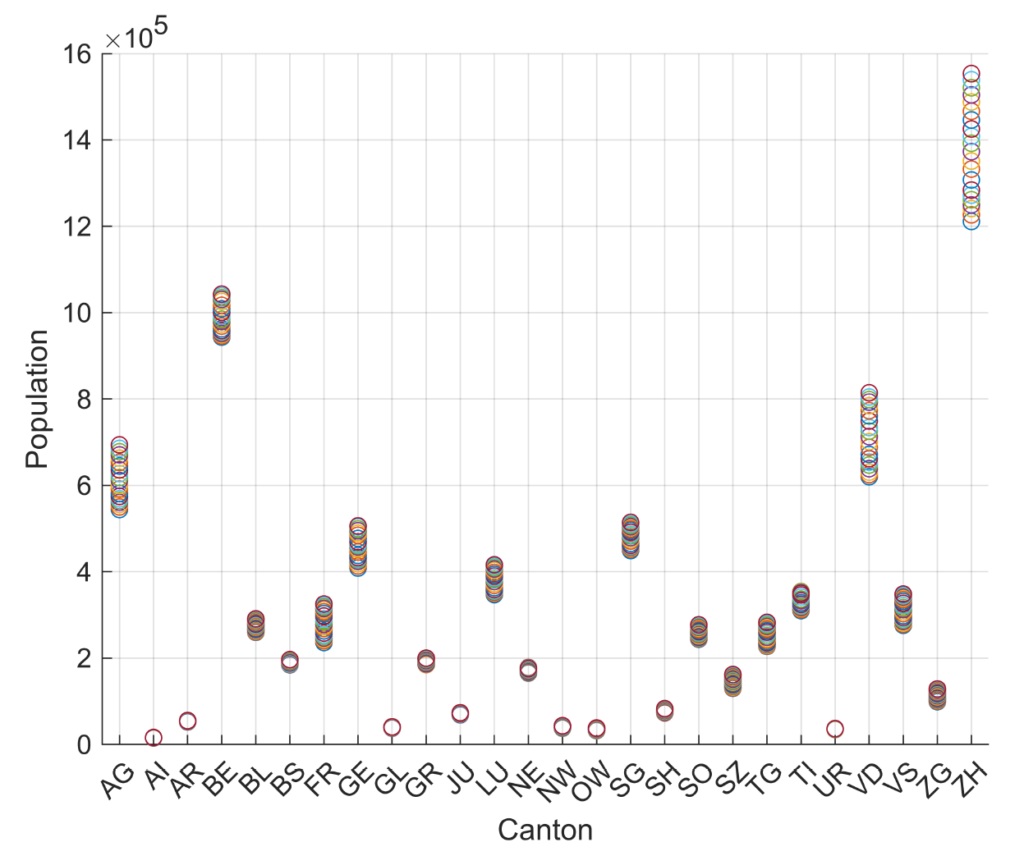
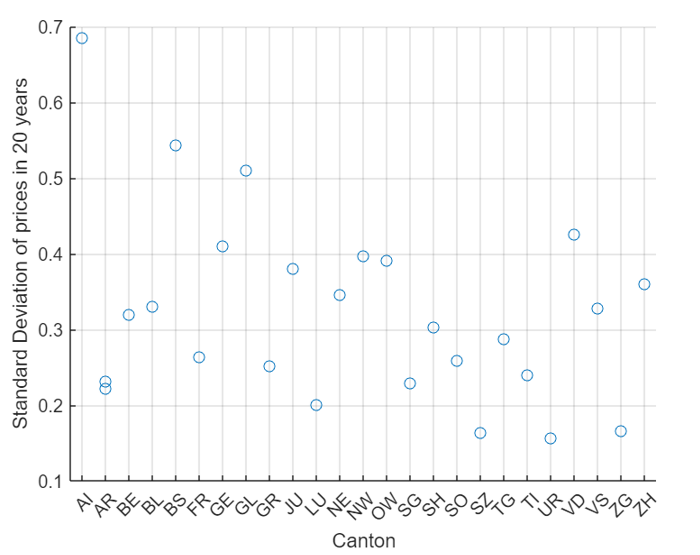
To have further detail on population, it is possible to use population change by canton using standard deviation, to see data variation through the years.
Houses Data
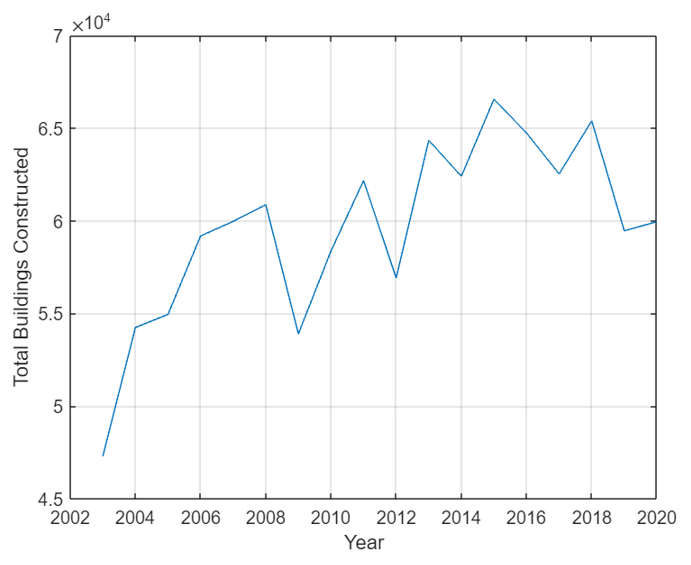
Data about constructions in switzerland is imported. This data covers from 2003 to 2020.
Rent average price m2/chf
Data is categorized by canton and year, from 2012 to 2020 and the value is expressed as average through 26 cantons. Due to lowering number of new construction, one can say that prices will growth. For this reason, this dataset can be usefull to study if there are some variation in the prices. Note that this values includes existing buildings and new constructed. Original dataset considers building older that 1919 up to 2021. For practical purposes, data was filtered.
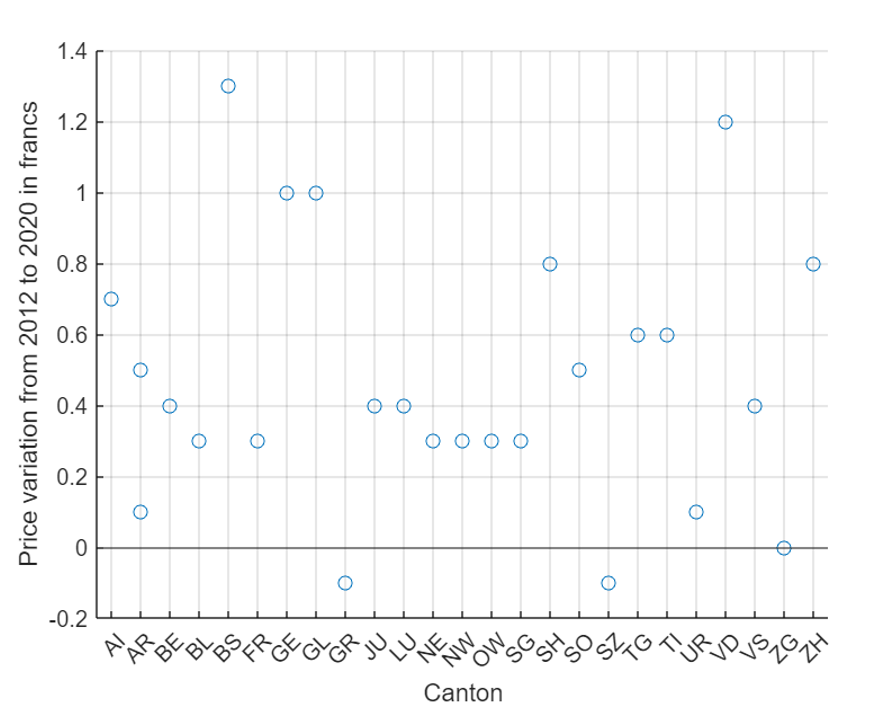
To have a better understanding, difference between 2012 and 2020 prices is summarized and plotted as follow:
Conclusion
The highest price deviation are the AI, Appenzeller Inner, second places is for BS, Basel City and third place is GL, Glarus cantons. . On the other hand, Basel Stadt has the higher variation in the prices, passing from 16.90 chf/m2 to 18.2 chf/m2.
Zurich city which has the highest population increase during the last 20 years, don’t show a proporcional increase in the price, passing 18.5 to 19.3 chf/m2.
A note from last graph is about zug that the price does not changes over 8 years, while Grisons and Schwyz the prices are lower the befor
It is worth to recall that prices are on average basis for all houses present in the canton and the price is referred only to rent, other expenses are not included like common heating, waste, cleaning, parking and other amenities.
Population-and-houses-growth-in-SwitzerlandAverage rent in Swiss francs according to the number of rooms and the canton | opendata.swiss
Thank you for your sharing. I am worried that I lack creative ideas. It is your article that makes me full of hope. Thank you. But, I have a question, can you help me?
yes go ahead