+41 768307656
info@htc-sagl.ch

Helvetica Technical Consulting

Key Distinctions between Scientists and Engineer, to empower Data Analytics

Data analytics is a growing field, where data scientists and engineers are crucial for its success. Both roles involve working with data, but have distinct responsibilities. Science is more like research, while data engineering is more like development. The first analyze data to extract insights and make predictions, while data engineers design and maintain systems to enable data scientists to work with data.

Data scientists ask the right questions and find meaningful insights from data, while data engineers build and maintain the infrastructure. Engineering involves building the infrastructure to support data science, while data science involves using that infrastructure to extract insights to make data usable, while data science makes sense of it.

Both data scientists and data engineers have strong employment prospects. The demand for data scientists is projected to grow by 16% between 2020 and 2030, and for computer and information technology occupations, which include data engineers, by 11%. The increasing importance of data-driven decision making across industries means that the demand for both roles will continue to rise.

If you want to become a data engineer or data scientist, there are various educational paths to take. Many universities offer undergraduate and graduate programs in data science, computer science, or related fields. Additionally, various online courses and bootcamps offer training in data analytics, machine learning, and other relevant skills.

Data science and data engineering have vast and varied applications. In healthcare, data analytics improves patient outcomes and streamlines processes. In finance, data analytics detects fraud and predicts market trends. In retail, data analytics personalizes marketing campaigns and optimizes supply chain operations. Data science and data engineering drive innovation and create value across industries.

Conclusion

In conclusion, data scientists and data engineers are critical for data analytics success, with essential, distinct responsibilities. The demand for both roles will continue to increase, as data-driven decision making becomes more important. Pursuing a career in data analytics offers various educational paths and fields of application to explore.

Further resources

  1. “Python Data Science Handbook” by Jake VanderPlas: https://jakevdp.github.io/PythonDataScienceHandbook/
  2. “Data Science Essentials” by Microsoft: https://docs.microsoft.com/en-us/learn/paths/data-science-essentials/
  3. “Data Engineering Cookbook” by O’Reilly Media: https://www.oreilly.com/library/view/data-engineering-cookbook/9781492071424/
  4. “Data Science for Business” by Foster Provost and Tom Fawcett: https://www.amazon.com/Data-Science-Business-data-analytic-thinking/dp/1449361323
  5. “Data Engineering on Google Cloud Platform” by Google Cloud: https://cloud.google.com/solutions/data-engineering/
  6. “Applied Data Science with Python” by Coursera: https://www.coursera.org/specializations/data-science-python

Supervised, Unsupervised & Reinforced Learning, a quick intro!

In the field of predictive maintenance for rotating equipment, machine learning algorithms can be classified into three categories: supervised learning, unsupervised learning, and reinforced learning. Each of these approaches has its strengths and weaknesses, and choosing the right approach depends on the nature of the problem at hand. In this essay, we will explore the differences between these approaches and their applications in the context of predictive maintenance for rotating equipment.

Supervised Learning

Supervised learning involves training a model on labeled data, where both the input data and the desired output are provided. The goal is to learn a function that can predict the output for new, unseen input data. In the context of predictive maintenance for rotating equipment, supervised learning can be used to predict the remaining useful life of a machine or to detect anomalies that may indicate the onset of a fault.

One common application of supervised learning in predictive maintenance is to analyze vibration data from rotating machinery. By training a model on labeled data that indicates when a fault occurred and the corresponding vibration patterns, the algorithm can learn to identify these patterns in real-time data and predict potential faults before they occur.

Unsupervised Learning

Unsupervised learning involves training a model on unlabeled data, where the input data is provided without any corresponding output. The goal is to find patterns or structures in the data that can be used to make predictions or identify anomalies. In the context of predictive maintenance for rotating equipment, unsupervised learning can be used to identify patterns or clusters in sensor data that may indicate the presence of a fault.

One common application of unsupervised learning in predictive maintenance is to use clustering algorithms to group similar data points together. By analyzing the clusters, it may be possible to identify patterns that are indicative of a specific type of fault or to detect anomalies that may indicate the onset of a fault.

Reinforced Learning

Reinforcement learning involves training a model to make decisions based on feedback from the environment. The goal is to learn a policy that maximizes a reward signal over time. In the context of predictive maintenance for rotating equipment, reinforced learning can be used to develop maintenance schedules that minimize downtime and reduce costs.

One common application of reinforced learning in predictive maintenance is to use a model to determine when maintenance should be performed based on the condition of the machine and the cost of downtime. By learning a policy that balances the cost of maintenance with the cost of downtime, it may be possible to develop a more efficient maintenance schedule that reduces costs and increases efficiency.

Choosing the Right Approach

The choice of machine learning approach depends on the nature of the problem at hand. Supervised learning is best suited for problems where labeled data is available, and the goal is to predict an output for new, unseen data. Unsupervised learning is best suited for problems where the data is not labeled, and the goal is to identify patterns or anomalies in the data. Reinforced learning is best suited for problems where the goal is to develop a policy that maximizes a reward signal over time.

In the context of predictive maintenance for rotating equipment, a combination of these approaches may be used to develop a comprehensive predictive maintenance strategy. For example, supervised learning can be used to predict the remaining useful life of a machine, unsupervised learning can be used to identify patterns or clusters in sensor data, and reinforced learning can be used to develop a maintenance schedule that balances the cost of maintenance with the cost of downtime.

Conclusion

In conclusion, machine learning algorithms can be classified into three categories: supervised learning, unsupervised learning, and reinforced learning. Each of these approaches has its strengths and weaknesses, and choosing the right approach depends on the nature of the problem at hand. In the context of predictive maintenance for rotating equipment, a combination of these approaches may be used to develop a comprehensive predictive maintenance strategy that minimizes downtime, reduces costs

Hydrogen from Ammonia, a fuel for the future

Green ammonia is an emerging technology that has the potential to revolutionize the production of hydrogen and significantly reduce carbon emissions. In this article, we will discuss the production of hydrogen from green ammonia, key production and money figures, companies involved, and future trends.

Production of Hydrogen from Green Ammonia

Green ammonia is produced by using renewable energy sources such as wind or solar power to power the Haber-Bosch process, which produces ammonia. Green ammonia can then be used as a feedstock for the production of hydrogen through the process of ammonia cracking. The reaction is endothermic, requiring a reactor heated to a high temperature of around 700-900°C to break down ammonia into its constituent elements, nitrogen and hydrogen.

Key Production and Money Figures

The production of hydrogen from green ammonia has several advantages over traditional methods, including zero carbon emissions and lower energy requirements. According to the International Energy Agency (IEA), the production of green ammonia is expected to reach 25 million tonnes by 2030 and 500 million tonnes by 2050. The IEA also estimates that the production of green ammonia could reduce the cost of producing hydrogen by up to 50% compared to traditional methods.

Companies Involved

Several companies are involved in the production of green ammonia, including Yara, the world’s largest producer of ammonia, and Siemens Energy, which has developed an electrolysis-based process for producing green ammonia. Other companies involved in the production of green ammonia include Ørsted, a leading renewable energy company, and Air Liquide, a global leader in industrial gases.

Future Trends

The future of green ammonia production looks bright, with the potential for significant growth and contribution to reducing carbon emissions in the energy and agricultural sectors. The IEA has identified green ammonia as a key technology that could help to reduce carbon emissions. Green ammonia has the added benefit of being used as a fertilizer, further reducing the carbon footprint of agriculture. In addition, the use of green ammonia in the shipping industry as a fuel is being explored as a potential replacement for fossil fuels.

Conclusion

Green ammonia is a promising technology that has the potential to revolutionize the production of hydrogen and significantly reduce carbon emissions. Key production and money figures suggest that the production of green ammonia could increase significantly over the next few decades, with the potential to reduce the cost of producing hydrogen by up to 50%. Several companies are involved in the production of green ammonia, and the future looks bright with the potential for significant growth and contribution to reducing carbon emissions in the energy and agricultural sectors.

Which Is The Difference Between Data Scientist And Data Engineer?

Data scientist and data engineer are both essential roles in the field of data analytics, but they have distinct responsibilities. According to Max Shron in “Thinking with Data: How to Turn Information into Insights,” “data science is more like a research project, while data engineering is more like a development project.” This means that while data scientists focus on analyzing data to extract insights and make predictions, data engineers are responsible for designing and maintaining the systems that enable data scientists to work with the data.

Andreas Müller and Sarah Guido echo this sentiment in “Introduction to Machine Learning with Python: A Guide for Data Scientists,” stating that “data scientists are concerned with asking the right questions and finding meaningful insights from data. Data engineers are responsible for designing and maintaining the systems that enable data scientists to work with the data.” DJ Patil and Hilary Mason similarly note in “Data Driven: Creating a Data Culture” that “data engineering involves building the infrastructure to support data science, while data science involves using that infrastructure to extract insights from data.”

Joel Grus adds in “Data Science from Scratch: First Principles with Python” that “data engineering involves building the infrastructure to support data science, while data science involves using that infrastructure to extract insights from data.” Finally, Martin Kleppmann sums it up in “Designing Data-Intensive Applications: The Big Ideas Behind Reliable, Scalable, and Maintainable Systems” by saying that “data science is about making sense of data, while data engineering is about making data make sense.”

In summary, data scientists focus on extracting insights from data, while data engineers focus on building the infrastructure to store and process that data. While there may be some overlap between the roles, they have distinct responsibilities and focus on different aspects of working with data. Both roles are crucial in modern data-driven organizations, and they often work together closely to achieve common goals

Rock Music is Alive and Powerful! Statistics from 1950 and 2020

This article was done to get some statistics about rock music and what big data analysis can do to gather or discover hidden useful information.

The following analysis gets the data from Kaggle, free license

What is Kaggle? According to online definitions, Kaggle, a subsidiary of Google LLC, is an online community of data scientists and machine learning practitioners. inside the website can be found courses, datasets, contest/challenges including money.

Dataset can be uploaded by single usernames or by companies during a competition.

 Scope of the Study

A lot of considerations can be made from the history of rock music, but the scope of this study is to support the changes that music rock did during the years.

Rock music, as an alternative of pop music (intended as common or soft) in the beginning was an underground music that gained fame during the years, with a constant increase. Some people or critics claim that rock is dead, but we will seek if there is a truth on this sentence.

  Data

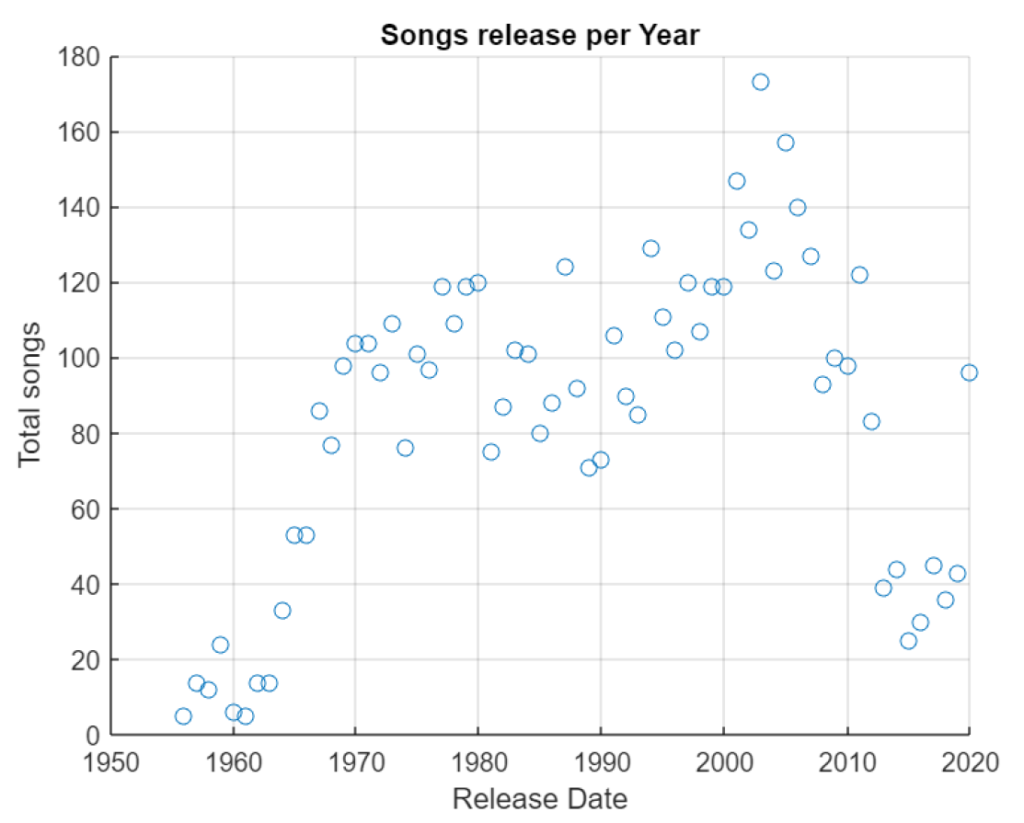
Dataset is from 2020 retrieved from spotify covering rock songs from 1950 to 2020 with 5484 songs and 17 tags/label to identify and classify a song. From the tag list, only popularity is an index from the audience feedback while the remaining tags describe the song characteristics.

  1. Index
  2. Name: Song’s name
  3. Artist
  4. Release date
  5. Length: in minutes
  6. Popularity: A value from 0 to 100
  7. Danceability: Describes how suitable a track is for dancing based on a combination of musical elements including tempo, rhythm stability, beat strength, and overall regularity.
  8. Acousticness: A confidence measure from 0.0 to 1.0 of whether the track is acoustic.
  9. Energy: Represents a perceptual measure of intensity and activity. Typically, energetic tracks feel fast, loud, and noisy. For example, death metal has high energy, while a Bach prelude scores low on the scale.
  10. Instrumentalness: Predicts whether a track contains no vocals. “Ooh” and “aah” sounds are treated as instrumental in this context. Rap or spoken word tracks are clearly “vocal”.
  11. Key: The estimated overall key of the track. Integers map to pitches using standard Pitch Class notation . E.g. 0 = C, 1 = C♯/D♭, 2 = D, and so on.
  12. Liveness: Detects the presence of an audience in the recording. Higher liveness values represent an increased probability that the track was performed live.
  13. Loudness: The overall loudness of a track in decibels (dB). Loudness values are averaged across the entire track and are useful for comparing relative loudness of tracks.
  14. Speechiness: This detects the presence of spoken words in a track. The more exclusively speech-like the recording (e.g. talk show, audio book, poetry), the closer to 1.0 the attribute value.
  15. Tempo: The overall estimated tempo of a track in beats per minute (BPM). In musical terminology, tempo is the speed or pace of a given piece and derives directly from the average beat duration.
  16. Time Signature: An estimated overall time signature of a track. The time signature (meter) is a notational convention to specify how many beats are in each bar (or measure).
  17. Valence: Describes the musical positiveness conveyed by a track. Tracks with high valence sound more positive (e.g. happy, cheerful, euphoric), while tracks with low valence sound more negative (e.g. sad, depressed, angry).

Popularity requires some clarification from analytical point of view and need some assumptions. We don’t know when the popularity was measured, monthly or yearly, and also in which year. Considering this lack of information, we will assume likelihood that popularity was calculed in 2020 when considering songs from 1950 to 2019.

Data Pre-processing & Feature Engineering

After loading the data, we need to manipulate it according to our scope of the study, more specifically we will count the letters both in the artist’s name and song’s name.

The name of the song contains some noise created by the versions mastered or remastered. this creates a distortion in the real name of the song. Most of time, remastering a song has the only effect to clean using new technologies and also to refresh the mind of people.

Since there are 5848 rows in the data, this creates a lot of noise, so the best way for filtering data, is to preprocesssing in aggregated way following statistical parameters, mean, max & min of the values for each year from 1956 to 2020. This leads to a new data set of 65 rows where every row is one year.

Below you can find complete pdf.

historyofrock

Wind energy or Photovoltaic, which is the best?

Nowadays there are several sources that are not affected by quantity limitations because are renewed by the nature in different way, they are the renewable energies. The two most common and developed are wind energy (on-shore and off-shore) and solar (as photovoltaic), with some advantages according to the location where they will be placed, both are governed by environmental conditions.

Wind energy has the greatest advantage high energy density which relates to energy production in kWh and land occupied in sqm because they are developed vertically, on the other hand wind turbines can handle wind speeds from 3 m/s (cut-in) to 25 m/s (cut-out parameter).

Solar, photovoltaic energy has the greatest advantage to be cheaper than wind turbine, no cut-out parameter but they require more land area to achieve same energy production.

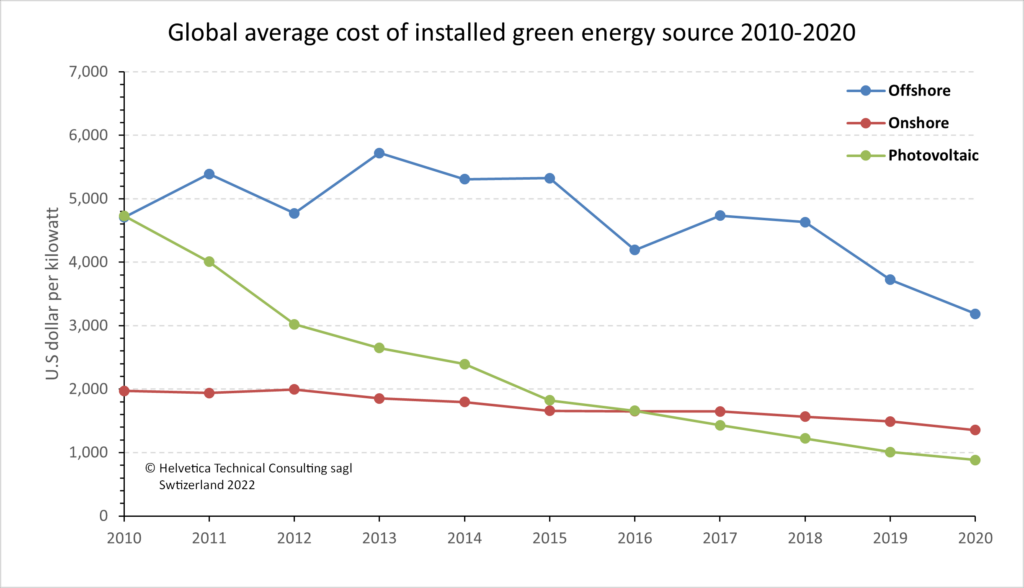
Over the years, cost of kW installed of both systems falls down until now when photovoltaic is cheaper the onshore wind energy, passing from barely 5000 usd/kW to less then 1000 usd in 10 years, while wind energy decreasing is less pronounced.

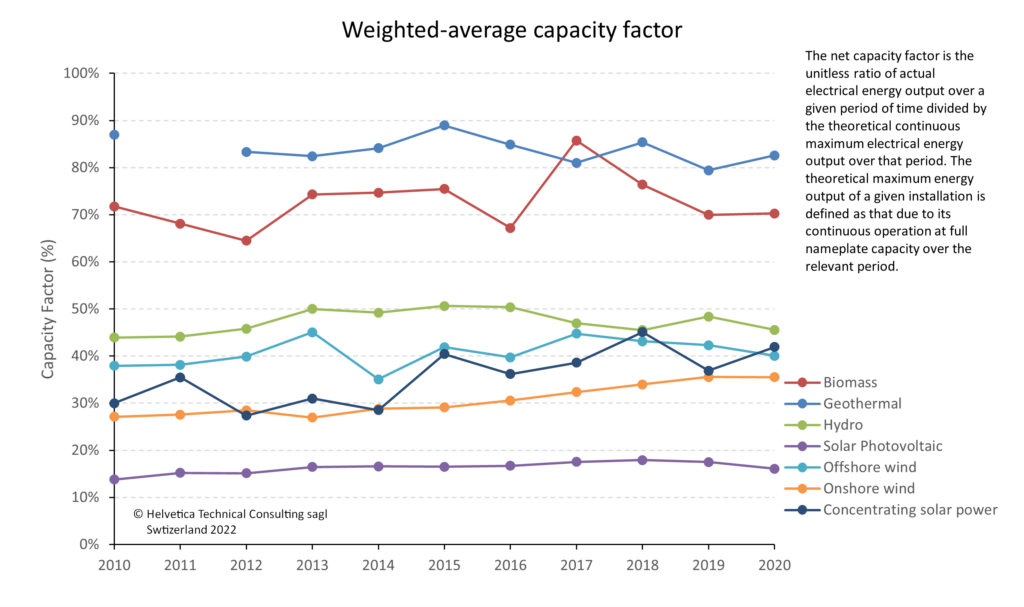
One the parameter that can help the reader to get a clear information of performance difference of both sources is the capacity factor.

Can be defined as the

unitless ratio of actual electrical energy output over a given period of time divided by the theoretical continuous maximum electrical energy output over that period.

The graph shows the capacity factor of all renewable energy sources and can be noticed that photovoltaic has a lower capacity than wind but at a cost that is 3 times lower than offshore wind and 0.5 times lower than onshore wind.

What is Data Driven Decision Making? A quick intro

Introduction

Data driven decision-making has become a buzzword in today’s business world. Companies are using data and analytics to drive their decision-making processes and gain insights into their operations. This approach allows them to optimize their processes, reduce costs, and increase revenue. In this article, we will delve into the concept of data-driven decision-making and its importance in companies. We will also explore the works of Erik Brynjolfsson, DJ Patil, and Hilary Mason, who have made significant contributions to the field.

What is Data-Driven Decision-Making?

Data-driven decision-making involves using data and analytics to drive business decisions. It is a process that involves collecting, analyzing, and interpreting data to gain insights into operations and identify patterns. By doing so, companies can make informed decisions that lead to better outcomes.

The process of data-driven decision-making involves several steps. First, data is collected from various sources, such as customer feedback, sales data, and operational data. The data is then cleaned and transformed into a format that can be analyzed. Once the data is prepared, it is analyzed using statistical methods to identify patterns and trends. Finally, the insights gained from the data analysis are used to make informed decisions.

Why is Data-Driven Decision-Making Important?

Data-driven decision-making has several benefits for companies. First, it allows them to optimize their operations and reduce costs. By analyzing data, companies can identify inefficiencies in their operations and take steps to improve them. This can lead to cost savings and increased profitability.

Second, data-driven decision-making can help companies to identify opportunities for growth and innovation. By analyzing customer data, companies can identify trends and develop new products and services that meet the needs of their customers. This can lead to increased revenue and market share.

Finally, data-driven decision-making can improve customer experience. By analyzing customer data, companies can gain insights into customer behavior and preferences. This can help them to tailor their products and services to better meet the needs of their customers, leading to increased customer satisfaction and loyalty.

Erik Brynjolfsson and Data-Driven Decision-Making

Erik Brynjolfsson is a renowned economist and Professor of Management at the Massachusetts Institute of Technology (MIT). He is a leading authority on the economics of information technology and has made significant contributions to the field of data-driven decision-making.

In a 2011 paper titled “Big Data: The Management Revolution,” Brynjolfsson and his co-author Andrew McAfee argued that data-driven decision-making was transforming business operations. They highlighted the importance of data-driven decision-making in improving operational efficiency and driving innovation.

The authors noted that companies that were data-driven were more likely to be successful in the long run. They cited examples of companies like Google, Amazon, and Netflix, who had embraced data-driven decision-making and achieved great success.

Brynjolfsson and McAfee argued that data-driven decision-making was becoming more accessible to companies of all sizes. They noted that the cost of data storage and processing had decreased significantly, making it easier for companies to collect and analyze data.

The authors also cautioned that data-driven decision-making was not a silver bullet. They noted that companies needed to have the right infrastructure, talent, and culture to make data-driven decisions successfully.

DJ Patil and Data-Driven Decision-Making

DJ Patil is a data scientist and entrepreneur who has worked for companies like LinkedIn, Greylock Partners, and the US government. He is known for his contributions to the field of data science and data-driven decision-making.

Patil has emphasized the importance of data culture in companies. He argues that companies need to develop a culture that values data and encourages data-driven decision-making. This involves creating a data-driven mindset among employees and promoting data literacy across the organization.

Patil also notes that companies need to invest in data infrastructure and technology. This includes data storage, processing, and analysis tools that enable companies to collect, clean, and analyze large amounts of data.

In a 2014 paper titled “Building Data Science Teams,” Patil emphasized the importance of collaboration in data-driven decision-making. He notes that data science teams need to work closely with business stakeholders to understand their needs and develop data-driven solutions that address those needs.

Patil also highlights the importance of experimentation in data-driven decision-making. He notes that companies need to be willing to experiment with new ideas and approaches, and to learn from their failures as well as their successes. This requires a culture of innovation and risk-taking, where failure is seen as an opportunity to learn and improve.

Hilary Mason and Data-Driven Decision-Making

Hilary Mason is a data scientist and entrepreneur who has worked for companies like Bitly and Fast Forward Labs. She is known for her contributions to the field of data science and her advocacy for data-driven decision-making.

Mason has emphasized the importance of data storytelling in data-driven decision-making. She argues that data needs to be presented in a way that is meaningful and engaging to stakeholders. This requires data scientists to have strong communication skills and the ability to tell compelling stories with data.

Mason also notes that companies need to focus on the right data. She argues that companies should prioritize data that is relevant to their business goals and objectives, rather than collecting data for the sake of collecting it. This requires companies to have a clear understanding of their business needs and to align their data collection efforts with those needs.

In a 2014 TED talk titled “The Urgency of Curating Data,” Mason emphasized the importance of data curation in data-driven decision-making. She notes that data needs to be curated and maintained to ensure its accuracy and reliability. This requires companies to invest in data governance and quality control processes, and to ensure that data is being used in a responsible and ethical manner.

Examples of Data-Driven Decision-Making

Data-driven decision-making has become increasingly common in companies across various industries. Here are a few examples of how companies are using data to drive their decision-making processes:

Netflix: Netflix is a prime example of a company that has embraced data-driven decision-making. The company uses data to personalize its content recommendations and to develop new content that meets the needs and preferences of its viewers. Netflix also uses data to optimize its operations and to improve customer experience.

Amazon: Amazon is another company that has leveraged data to drive its decision-making processes. The company uses data to optimize its supply chain and to improve its logistics operations. Amazon also uses data to personalize its product recommendations and to develop new products and services that meet the needs of its customers.

Ford: Ford is using data to drive its innovation efforts. The company is collecting data from its connected cars to gain insights into customer behavior and preferences. This data is being used to develop new products and services that meet the needs of Ford’s customers.

Conclusion

Data-driven decision-making has become essential in today’s business world. Companies that embrace data-driven decision-making are more likely to succeed in the long run, as they can optimize their operations, identify opportunities for growth and innovation, and improve customer experience. Erik Brynjolfsson, DJ Patil, and Hilary Mason have made significant contributions to the field of data-driven decision-making, emphasizing the importance of data culture, collaboration, storytelling, and curation. Examples of companies like Netflix, Amazon, and Ford show how data-driven decision-making is transforming business operations and driving innovation. As data becomes increasingly important in business decision-making, companies that can effectively collect, analyze, and interpret data will have a significant competitive advantage.
Natural Gas in Italy, a deep insight into the market

After several months of research, we are happy to announce our first report about LNG & Natural Gas energy in Italy. This report is the result of thorough research, data analysis, and consultations with experts in the energy sector. With over 60 pages filled with graphs, tables, and useful information, this report serves as a valuable tool for journalists, data-driven companies, and market insiders.

Natural gas is a significant source of energy in Italy, accounting for over 30% of the country’s total energy consumption. Italy is the third-largest natural gas consumer in Europe, after Germany and the United Kingdom. The country’s high dependence on natural gas has been driven by a combination of factors, including its role as a transitional fuel towards decarbonization, its flexibility in balancing intermittent renewable energy sources, and its relatively low carbon intensity compared to other fossil fuels.

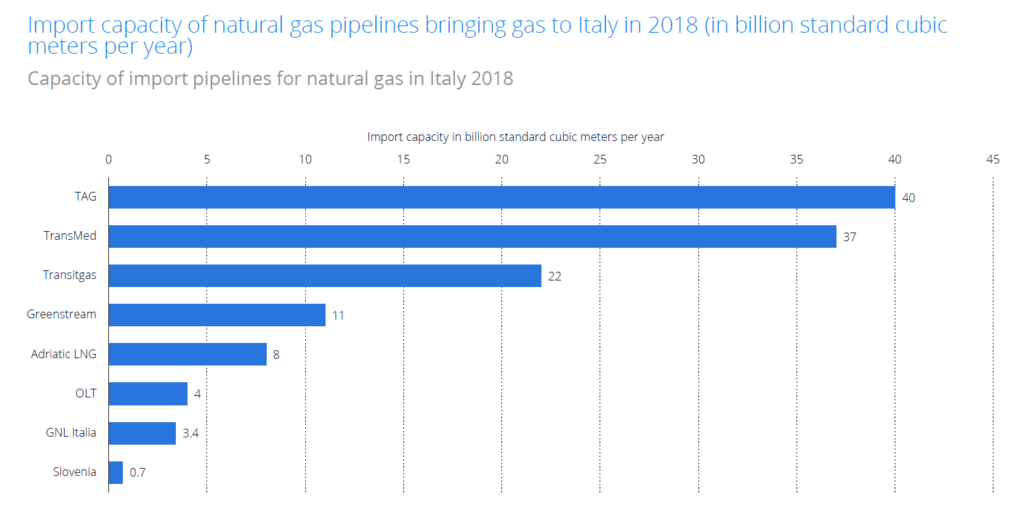
The Italian natural gas market is characterized by a high level of integration with the European market, with cross-border pipelines connecting Italy to several neighboring countries, including France, Switzerland, and Austria. The country also has access to liquefied natural gas (LNG) through several import terminals located along the coast. These terminals receive LNG shipments from countries such as Qatar, Algeria, and Nigeria.

One of the key drivers of the Italian natural gas market is the power sector, which accounts for over 40% of the country’s total gas consumption. Natural gas is widely used for electricity generation, both in combined cycle gas turbines (CCGTs) and open cycle gas turbines (OCGTs). The use of natural gas in power generation is driven by its flexibility, low emissions, and relatively low cost compared to other fossil fuels.

Another important sector for natural gas in Italy is the residential and commercial sector, which accounts for around 30% of the country’s total gas consumption. Natural gas is widely used for space heating, hot water production, and cooking in households and commercial buildings. The use of natural gas in the residential and commercial sector is driven by its convenience, low emissions, and relatively low cost compared to other fuels such as oil and propane.

The industrial sector is another important consumer of natural gas in Italy, accounting for around 25% of the country’s total gas consumption. Natural gas is widely used in the industrial sector for process heat, steam production, and as a feedstock for the production of chemicals and fertilizers. The use of natural gas in the industrial sector is driven by its reliability, flexibility, and relatively low cost compared to other fuels such as coal and oil.

The Italian natural gas market is highly competitive, with several players operating in different segments of the value chain. The upstream segment is dominated by ENI, the country’s largest integrated energy company, which has a significant presence in the exploration and production of natural gas both in Italy and abroad. Other important players in the upstream segment include Edison, TotalEnergies, and Shell.

The midstream segment of the natural gas value chain in Italy is characterized by a high degree of infrastructure development, including pipelines, storage facilities, and LNG terminals. The infrastructure is operated by several players, including Snam, the country’s largest natural gas infrastructure company, and international players such as Fluxys, GRTgaz, and Trans Austria Gasleitung.

The downstream segment of the natural gas value chain in Italy is characterized by a high level of competition among gas distributors and retailers. The gas distribution network in Italy is owned and operated by several companies, including Snam, Italgas, and Hera. Retailers compete with each other to offer natural gas to residential and commercial customers, with players such as Enel Energia, Eni Gas e Luce, and Edison Energia.

Despite the significant role of natural gas in Italy’s energy mix, the country faces several challenges related to its energy transition. The transition towards a more sustainable and low-carbon energy system is a priority for Italy, which aims to achieve carbon neutrality by 2050. To achieve this goal, the country needs to reduce its dependence on fossil fuels, including natural gas, and increase the use of renewable energy sources such as solar, wind, and hydropower.

One of the main challenges for Italy’s energy transition is the need to ensure energy security and affordability while reducing greenhouse gas emissions. The country’s reliance on natural gas as a transitional fuel presents a trade-off between reducing emissions in the short term and achieving long-term decarbonization goals. To address this challenge, Italy needs to accelerate the deployment of renewable energy sources, improve energy efficiency, and develop new technologies to enable the decarbonization of the natural gas sector, such as carbon capture and storage (CCS) and hydrogen production.

Another challenge for Italy’s energy transition is the need to address the social and economic impacts of the transition, particularly in regions that are heavily dependent on fossil fuels. The closure of coal-fired power plants and the shift towards renewable energy sources and natural gas may have significant implications for local communities and workers. To address these impacts, Italy needs to develop a comprehensive strategy for a just transition that includes measures to support affected communities, provide retraining opportunities for workers, and ensure a fair and equitable distribution of the benefits of the transition.

In conclusion, natural gas is a significant source of energy in Italy, with a wide range of applications in the power, residential and commercial, and industrial sectors. The country’s high dependence on natural gas presents both opportunities and challenges for its energy transition towards a more sustainable and low-carbon energy system. Our report provides valuable insights into the Italian natural gas market, its key players, and its role in the country’s energy mix. We hope that this report will serve as a useful tool for journalists, data-driven companies, and market insiders and contribute to the ongoing discussions about Italy’s energy transition.

With more than 60 pages full of graphs and useful information, our report is a tool for journalists, data-driven companies and marked insider.

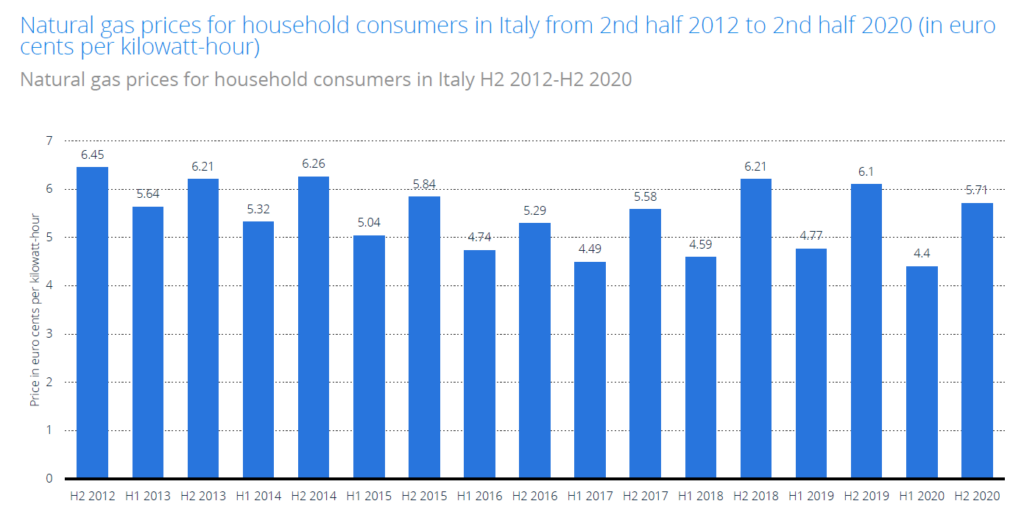
Below you can find some excerpts of the content of the book.

If you are interesed in a copy of this selected report, write to us info@htc-sagl.ch

Do you like vibrations? Have fun!

Fourier wave generator

Wave generation concept & theory is the key to understand vibrations in industry with a consequence on maintenance.

Discrete: Allows you to create a wave choosing the armonics value. turn on the speaker to hear it!

Wave Game: Try to match the wave below by chosing armonics values. there are 5 levels, level 1 with one armonic, level 5 with 5+ harmonics

Wave Packet: A full in depth view of fourier wave generation

Waves on a string

With this game you can study the effects of resonance, wave fundamentals and damping. Try to play around with frequency, amplitude, damping and tension.

Have fun!

Wind Power Generation

A technical review

Wind power generation is the most preferred among all renewable sources of energy, since the ratio between the dimension of the basement with energy produced is very high if compared with solar or hydro.

Wind power generation is not a new technology. The first turbine used for power generation was built in 1883 in Glasgow Scotland by professor James Blyth

The world’s first windfarm was in 1980 consisting of 20 turbines is built in New Hampshire, but due to a failure, the project was abandoned

But after 10 year of experimenting and testing, the first offshore wind farm was installed in the 90’s in Vindeby (Denmark), with a total power of 450kW.

From that day, improvement in technology, R&D and materials led to increase in power generation by wind with a decreasing cost.

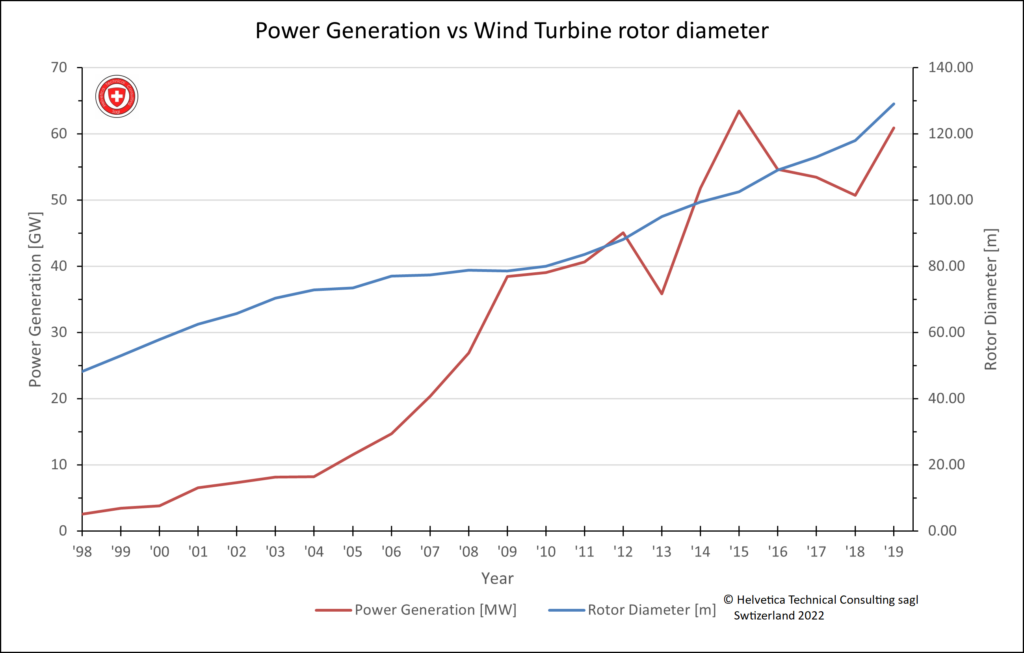
Power generation against wind turbine diameter

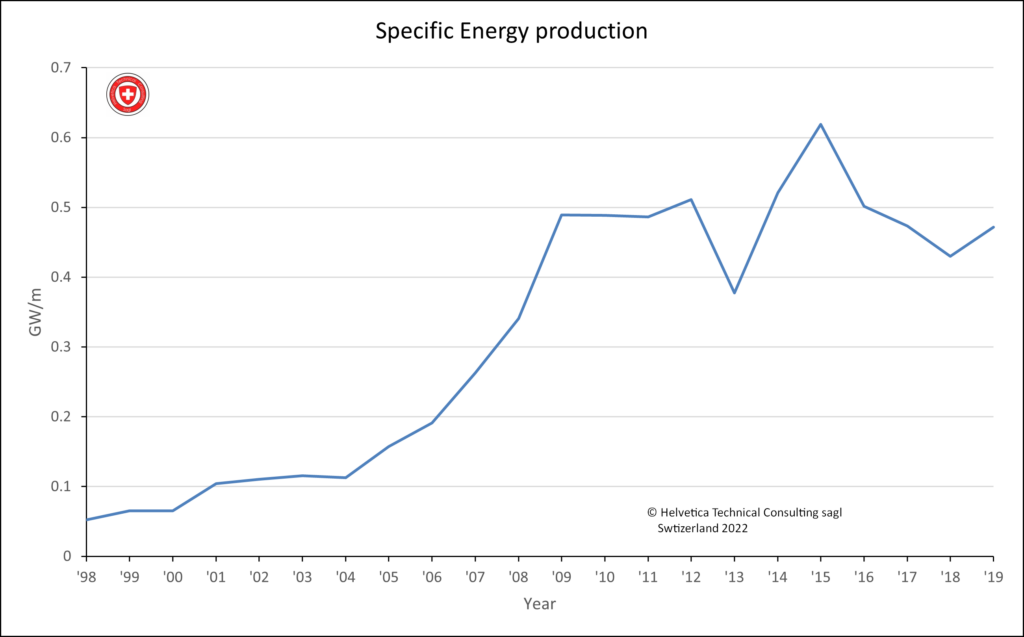
In the graph it is possible to see increasing rotor diameter and the worldwide power generation. The swing between 2013-2015 neutralize themself. From the information above it is possible to obtain the specific power generation per meter (as diameter) of the rotor.

Energy produced per meter of the rotor

It is worth to highlight that from 2008 the GW/m remains mostly unchanged until 2016; as said before the swing 2013-2015 is neutral to the analysis.